The factory Know-How Reference Guide.
Concepts, metrics, formulas and examples from the factory product areas – neatly organized, searchable, and directly linked to the relevant product pages.
 AM Asset ManagementKnow-How ↓
 BowTie Risk ManagementKnow-How ↓
 CLM Contract ManagementKnow-How ↓
 CRM Contact ManagementKnow-How ↓
 Dashboard ControllingKnow-How ↓
 Data Visualization PortalKnow-How ↓
 DMS & Document Control CenterKnow-How ↓
 FM Facility ManagementKnow-How ↓
 Kanban Team ManagementKnow-How ↓
 MPM Multi-Project ManagementKnow-How ↓
 Skill ManagementKnow-How ↓
 Workflow EngineKnow-How ↓
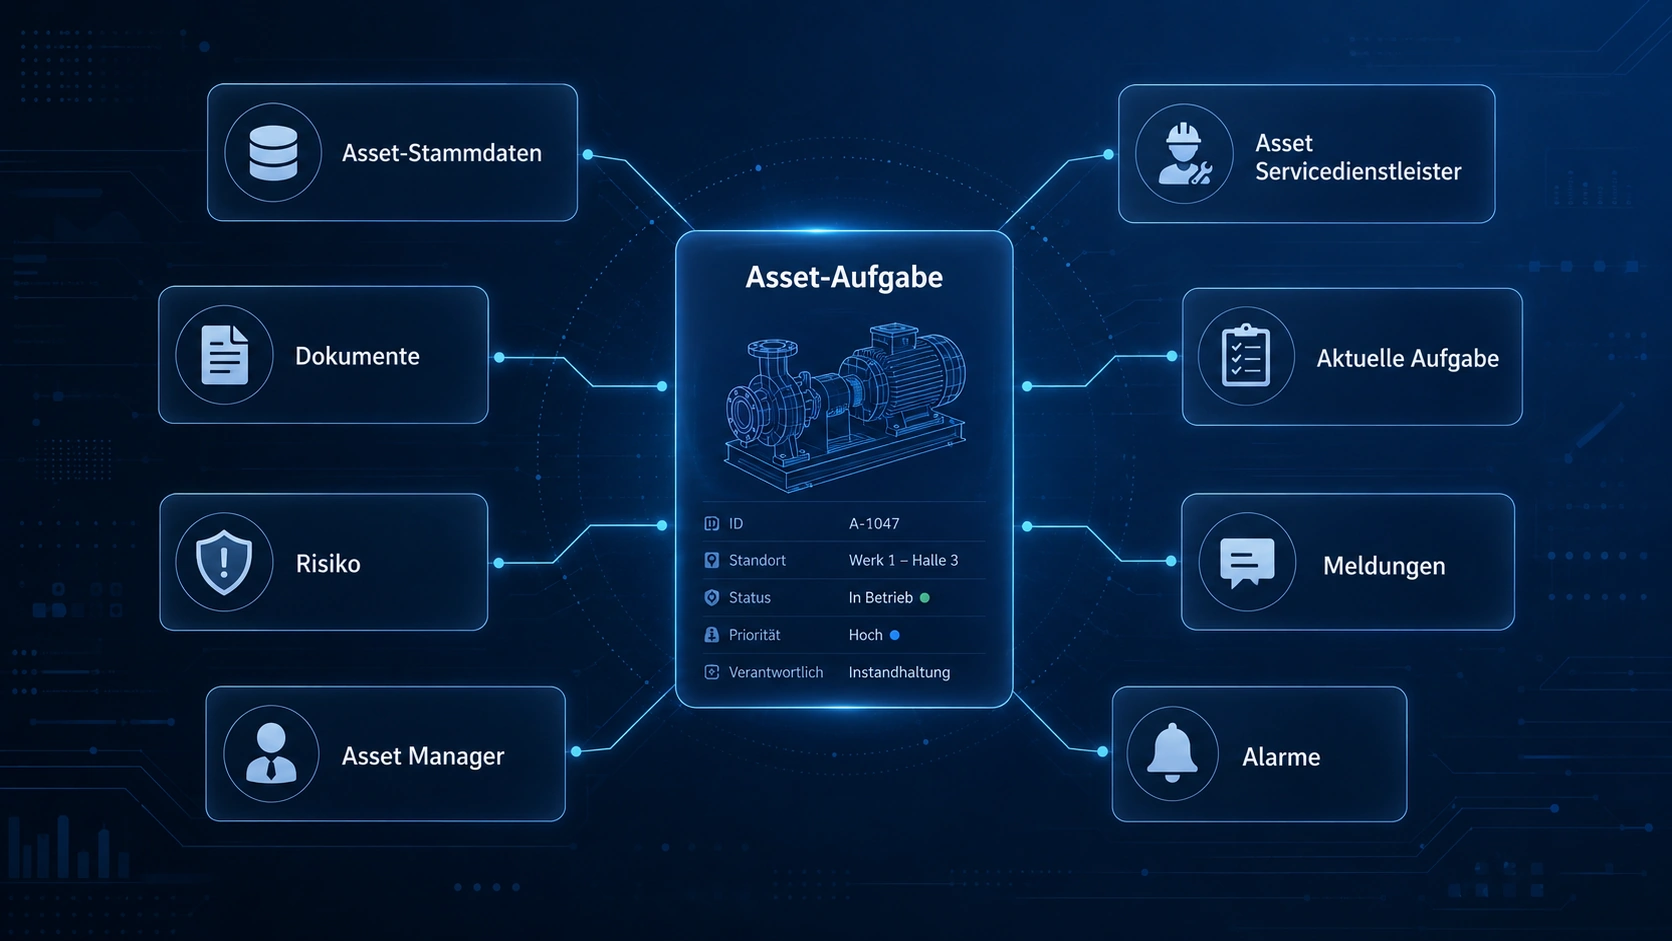
factory Asset Management.
Key takeawayThe factory Asset Management Control Center turns networks, plants, buildings, vehicles and infrastructure into active management objects – freely configurable across all asset categories, from the digital twin to an ISO 55001 management system.
Asset management as an active control center: manage assets, inspection obligations, deadlines, documents, risks and measures centrally – from the digital twin to an ISO 55001 management system. The decisive difference is customizability across all asset categories: networks, plants, buildings, vehicles, equipment, medical technology or municipal infrastructure are mapped precisely to your structures, roles and processes – according to your individual schema.
Go to product page: AM Asset Management ↗
The central USP: customization across all asset categories.
Our Asset Management Control Center remains freely configurable across all asset classes – it adapts to your reality. Flexible customization produces exactly the asset objects, attributes, deadlines, workflows, documents and dashboards your organization actually needs.
This turns a platform into a control center tailor-made for every asset category: from a single piece of equipment to complex technical infrastructure.
From asset register to active Asset Management Control Center.
An asset register on its own is an inventory. The control center turns it into management: master data, condition values, inspection obligations, documents, risks, measures and responsibilities are brought together. The system recognizes where action is needed, dispatches tasks, monitors deadlines and documents decisions in an audit-ready way.
What is an Asset Management Control Center?
A control center is a technical system for the online management of complex processes. It is used wherever many different pieces of information need to be continuously brought together, evaluated and translated into fast, well-founded decisions.
The Asset Management Control Center applies this principle to technical assets: it bundles master data, condition values, inspection obligations, documents, risks, measures and responsibilities in a central digital workspace. Mobile teams, sensors and IoT devices, ERP, GIS and DMS systems, and management cockpits all work on a shared, role-based information base.
What is an asset?
An asset is a value or operational object that an organization operates, monitors or is responsible for. Assets are more than classic plants: equipment, vehicles, buildings, network sections, medical technology or municipal infrastructure can also be managed as assets.
Every asset can carry location, condition, criticality, responsible parties, inspection obligations, documents, costs and history. This turns the object from a mere inventory entry into a manageable information object.
Customization across all asset categories
The control center's central USP is its customizability across all asset categories. The system remains freely configurable across all asset classes and maps networks, plants, buildings, vehicles, equipment, medical technology or municipal infrastructure to the structures, roles and processes of the respective organization.
Flexible customization produces exactly the asset objects, attributes, deadlines, workflows, documents and dashboards an organization actually needs – tailored precisely to its individual schema. This turns a platform into a control center tailor-made for every asset category: from a single piece of equipment to complex technical infrastructure.
Asset register & structuring
The asset register is the structured inventory management of all assets. In the control center, complex, multi-level hierarchies can be mapped exactly as needed – geographically by network area or functionally by plant, assembly group and component.
Individual attributes can be defined per level: technical characteristics, condition, H2 suitability, CapEx/OpEx, residual value, CO₂ relevance, risk classes and responsibilities. The register thus becomes the data foundation for deadlines, measures, risks and dashboards.
Digital twin
A digital twin is the structured digital representation of a real asset or an entire asset landscape. It connects master data, hierarchy, condition, documents and history into an overall picture.
In the control center, the digital twin emerges "made to measure": the depth of mapping – from property to plant to individual component – is adapted to the actual structure through customization.
Technical location & asset ID
The asset ID uniquely identifies a single asset. The technical location describes the functional or physical "installation site" within the structure – independent of which specific asset is currently installed there.
This separation makes replacement, conversion and history traceable: a piece of equipment can change its technical location while the history of both the location and the asset is preserved.
Criticality
Criticality describes how significant an asset is for supply, safety, operations or compliance. It results from failure consequences, supply relevance, safety aspects and economic impact.
In the control center, criticality drives prioritization: inspection deadlines, measures and investments are applied first where a failure would have the greatest consequences.
Deadline WatchDog
The WatchDog automatically monitors critical dates and deadlines. A trigger can be set on any relevant date – for inspection deadlines, maintenance intervals, warranty and contract expirations, each with an individual lead time.
Responsible roles are notified proactively; overdue tasks are visibly escalated. This way, organizational and inspection obligations (e.g. TÜV, DGUV) are fulfilled in a traceable manner.
Inspection obligations & operator obligations
Inspection and operator obligations are legally or regulatorily mandated checks on assets. In the control center, inspection-obligated objects are managed with obligation type, standard deadline, responsible party, service provider, evidence document and escalation rule.
This creates traceable proof that inspections were requested, carried out and documented on time.
Maintenance strategies
The control center supports various maintenance strategies: time- and interval-based maintenance, condition-based maintenance, predictive approaches, and risk-based residual-operation and decommissioning strategies.
Which strategy makes sense for which asset depends on criticality, condition, cost and failure consequences. The control center makes these fundamentals visible and manageable.
Measure management
Measure management means deriving concrete actions directly from an asset's condition. Workflows and measures are generated from the asset itself – with deadlines, priorities, responsible parties, documents and status history.
This turns observation into management: maintenance, fault clearance, residual operation or decommissioning are handled as traceable cases.
Mobile feedback at the asset
Technicians, inspectors and service partners record status, photos, measurements, approvals and notes directly on site at the object – including timestamp, responsibility and documentation.
Every piece of feedback is assigned to the asset, making it transparent which measure was carried out when and by whom. This is the basis for a reliable measure history.
Integrated DMS at the asset
Technical drawings, inspection reports, photos, warranty certificates and audit evidence are stored directly at the asset. Documents are managed with versioning, validity, approval, reminders and history.
This keeps it visible at all times which piece of evidence was valid when – a document control center as an integrated part of asset management.
Asset dashboard & management cockpit
The asset dashboard condenses condition, criticality, open measures, inspection deadlines, risks, costs and investment needs into steering views for management, business units and service partners.
Management, business units and service partners thus work on a shared information base – from the operational measure to the strategic portfolio decision.
ISO 55000 / ISO 55001
The ISO 55000 series of standards describes a management system for assets. ISO 55001 defines the requirements against which an asset management system can be certified.
The control center structurally reflects the logic of ISO 55000 ff. and supports, organizationally and technically, preparation for ISO 55001 certification – as a link between strategic goals and operational activity.
Strategic Asset Management Plan (SAMP)
The Strategic Asset Management Plan translates corporate objectives into long-term asset strategies: target states, measure programs, responsibilities and review cycles.
In the control center, these strategies are digitized and monitored, so that strategic goals and operational activity are traceably linked.
Continuous improvement & management review
The continuous improvement process (CIP) and management review derive concrete optimizations from incidents, audits or reviews.
In the control center, their implementation is tracked with audit-ready traceability, including responsibility and history – a central requirement of a certifiable management system.
KRITIS & critical infrastructure
KRITIS stands for critical infrastructures – organizations and facilities whose failure would have significant consequences for public supply or public safety.
For KRITIS operators, traceability, inspection deadlines and risk assessment are especially relevant. The control center can be operated as SaaS or KRITIS-compliant on-premises.
Equipment is an asset too
Machines, special tools, measuring devices, mobile test equipment, containers, pumps, backup units or site equipment can be managed as independent assets – with location, responsible party, condition, availability, inspection obligations, maintenance history, documents and usage history.
This makes it visible where a piece of equipment is deployed, when the next inspection is due, and whether repair, replacement or new purchase makes sense.
Vehicles are assets too
Fleets, service vehicles, special vehicles, trailers, aerial platforms or mobile workshops are managed with technical, commercial and organizational data: maintenance, inspections, insurance, leasing, mileage, damage and vehicle documents remain centrally available.
The control center links fleet management with measure management: deadlines are monitored, responsible parties informed, inspection reports documented, and costs, utilization and availability made transparent on the dashboard.
Managing network assets transparently
Line sections, control stations, transformer stations or technical network nodes are managed with year of construction, material, condition, criticality, measure history and strategic relevance.
The WatchDog secures regulatory inspection deadlines, while the cockpit makes technical and economic decision bases visible – including topics such as transformation and H2 suitability.
Managing municipal assets
Buildings, roads, bridges, lighting, playgrounds and technical facilities can be centrally managed – with inspection deadlines, road-safety obligations, documents and responsibilities in the cockpit.
Condition, risk, obligation status and budget impact are evaluated and form the decision basis for renovation, committees and budget planning.
Critical technical assets & medical technology
Cooling systems, technical building equipment, medical technology or security systems receive maintenance contracts, fault histories, inspection evidence, condition data and responsibilities directly at the asset.
For hospitals, prioritization by supply relevance, failure risk and patient safety, along with hygiene, safety and compliance requirements, is central. Pending measures are managed, documented and stored in an audit-ready history.
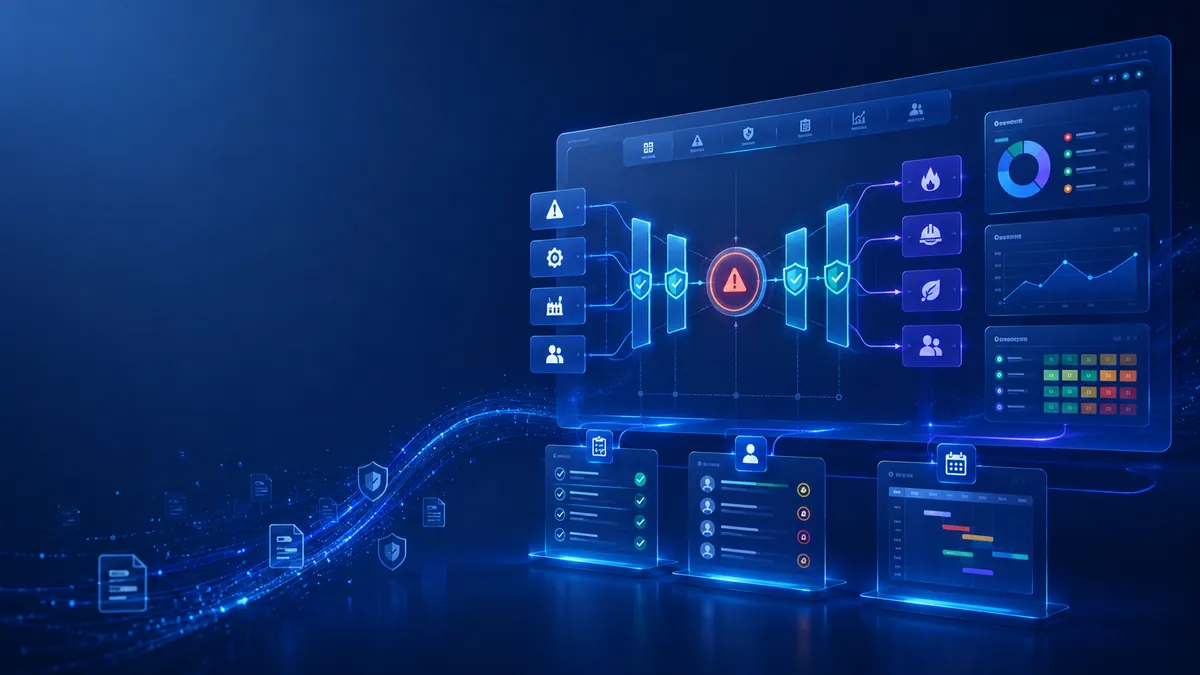
factory BowTie Risk Management.
Key takeawayThe factory BowTie Portal turns individual risks into a company-wide situational picture – with threats, barriers, consequences and risk values as the basis for prioritization, measures and investment decisions.
Risk management as an active control center – and more: the real USP goes beyond the method itself: the overall situational picture it creates for corporate steering. Risks from technology, IT, processes, suppliers, organization and compliance are consolidated into a shared management situational picture – with clear prioritization, cost, impact, responsibilities, measure status and budget needs.
Go to product page: BowTie Risk Management ↗
The basic logic: causes on the left, the risk in the middle, consequences on the right.
The BowTie method cleanly separates risk logic: threats trigger a central risk event; consequences can follow from it. Barriers are placed exactly where they act – preventively before the risk, or reactively after it.
From risk model to management situational picture.
The BowTie Portal turns individual risk models into manageable management information. Every barrier is managed with a responsible person, deadline, status, impact, cost and approval. Risk values, open measures and warning thresholds are condensed into a situational picture.
The real USP: the overall situational picture for corporate steering.
The BowTie Portal consolidates risks from different areas – technology, IT, processes, suppliers, organization and compliance – into a shared management situational picture. Management, the board or the Risk Director immediately see which risks are critical or existential, where barriers are missing, and which measures need to be prioritized. Risks become tangible: translated into cost, impact and concrete investment decisions.
The USP: the situational picture as a decision-making tool
The BowTie Portal's real USP goes beyond the method: the overall situational picture it creates for corporate steering. Individual risk models are combined into a shared management insight.
This turns BowTie from an analysis model into a decision-making tool: a situational picture spanning all risk areas, with clear prioritization, responsibilities, measure status and budget needs. Management, the board or the Risk Director immediately recognize where action is needed.
Company-wide situational picture across all risk areas
The BowTie Portal consolidates risks from different areas – technology, IT, processes, suppliers, organization and compliance – into a shared management situational picture. Functional, procedural, technical, organizational and supplier-related risks become visible together in one aggregated picture.
Management thus sees the overall risk at a glance – across business units, departments and company boundaries, in one shared view.
From risk to cost, impact and investment decision
The particular advantage: risks become tangible – translated into cost, impact and concrete investment decisions. Threat level, consequence costs, measure costs and benefit perspective are calculated.
This makes it visible which resources are needed to effectively reduce material risks, and which measures deliver the highest contribution to risk reduction. Budgets for risk reduction are traceably justified.
Residual risk: when risks remain in the red zone despite measures
Some risks can only be partially controlled with reasonable effort. The situational picture makes transparent which risks remain in the red zone despite measures – i.e. remain critical or existential.
This transparency is itself a management decision: the company consciously decides which residual risk to carry, and checks whether the overall risk position still matches its risk-bearing capacity.
Situational picture for the board, executive committee and Risk Director
The situational picture is the central management information for the top steering level. The board, executive committee, Risk Director and oversight bodies receive clear answers: which risks are material? Where to invest? How is the overall risk developing? When is action needed?
Management, risk manager, business unit leads, risk owners and the risk team all work within the same system – with visible responsibilities and traceable delegation.
What is the BowTie method?
The BowTie method is a visual method for structured risk analysis. It places threats on the left, the central risk event – the Top Event – in the middle, and possible consequences on the right.
Barriers are modeled between these areas: measures, controls or prepared responses that either prevent the risk from occurring or limit its consequences. The name comes from the shape of the model: fanned out left and right, bundled in the middle – like a bow tie.
Threat
A threat is a trigger or cause that can lead to the Top Event occurring. Threats sit on the left side of the BowTie model.
Examples include power outage, software failure, staff shortage, market change, supplier failure, regulatory change or human error.
Important: threats explain why a risk can occur. They do not yet describe the later consequences.
Top Event / central risk event
The Top Event is the central moment in the BowTie model: a threat has taken effect, control over a situation has been lost, and consequences can follow.
Examples: "control room goes down", "data loss occurs", "supply shortage arises", "critical plant stops" or "market position is lost".
On the left, what leads to the Top Event is evaluated. On the right, what consequences can result from it are evaluated.
Consequence
A consequence is a possible outcome that can arise after the Top Event occurs. Consequences sit on the right side of the BowTie model.
Typical consequences include revenue loss, claims for damages, reputational harm, delays, additional costs, supply outage, loss of production capacity, quality problems, or regulatory sanctions.
Once the risk has already occurred, this side is about mitigation, correction, recovery and damage limitation.
Barrier
A barrier is a measure, control or prepared response that makes a risk manageable. Barriers can inform, warn, prevent, mitigate, correct, replace or stop.
In the BowTie Portal, every barrier is managed as an operational task – with a responsible person, deadline, workflow status, cost, expected impact and approval. This turns risk analysis into concrete risk management.
Key takeaway: A barrier is only effective if it is functionally appropriate, organizationally owned and operationally tracked.
Preventive barrier
A preventive barrier acts on the left side of the BowTie model. It reduces the probability that a threat leads to the Top Event.
Examples: dual control, technical redundancy, access protection, maintenance plan, training, early-warning indicator, supplier audit or automatic plausibility check.
Preventive barriers serve to avoid or reduce risk before the central risk event occurs.
Reactive barrier
A reactive barrier acts on the right side of the BowTie model. It limits the consequences after the Top Event has occurred.
Examples: emergency plan, backup process, crisis communication, restart plan, insurance, backup supplier, technical switchover or a prepared fault clearance procedure.
Reactive barriers are part of risk mitigation: they cushion the consequence and shorten the time to recovery.
Risk value
The risk value links the threat level with the possible economic consequences. It helps to compare risks and prioritize investment in barriers in a traceable way.
The basic question is: how do the plannable costs of prevention or mitigation compare to the possible costs if the risk occurs?
Threat level
The threat level describes how relevant and probable a risk's threats currently are. It can change due to technology, market, organization, staffing, legislation, suppliers or external events.
In the BowTie Portal, the threat level is more than an assessment; it triggers a steering signal: When it rises, barriers can be prioritized, additional controls triggered, or escalations started.
Consequence costs
Consequence costs are the financially evaluated impacts of a consequence. This includes direct costs such as repair, replacement, contractual penalties or production downtime, as well as indirect costs such as customer loss, reputational damage or additional management effort.
Consequence costs make it visible which consequences are really material and where reactive barriers make economic sense.
Cost-benefit assessment of a barrier
A barrier causes plannable costs: setup, operation, inspection, training, documentation or technical implementation. Against this stands its benefit: lower probability of occurrence, reduced impact, or faster recovery.
The BowTie Portal makes this trade-off transparent. Budgets can thus be deployed exactly where they deliver the greatest contribution to risk reduction.
Management situational picture
The situational picture is the aggregated overall view of all modeled risks. It condenses individual risks into a management overview with risk values, threat levels, measure status, open barriers, warnings and priorities.
The situational picture answers the management question: where does the company stand, where is action needed, and how is the risk profile developing over time?
Risk-bearing capacity
Risk-bearing capacity describes an organization's ability to absorb the financial, operational and reputational consequences of occurring risks without jeopardizing its existence or ability to act.
The situational picture makes aggregated risk values, warning thresholds and escalation needs visible. This allows management to recognize whether the overall risk position still matches the company's risk-bearing capacity.
Risk alert, warning thresholds and escalation
A risk alert arises when defined threshold values are exceeded – for example, rising threat level, high consequence-cost impact, overdue barriers, or exceeded risk-bearing capacity.
Warning thresholds and escalations ensure that risk management becomes active: the system informs the responsible roles, starts workflows and makes decision needs visible in the situational picture.
Risk inventory
The risk inventory systematically checks the risk situational picture for currency. It is carried out regularly or as needed – for example, when new legal requirements, new technology, changed organization, new market participants, new suppliers, new findings or changed staffing arise.
In the BowTie Portal, the risk inventory is a structured process: risks are reviewed, threats and consequences updated, barriers assessed, and cost-benefit decisions prepared.
Risk manager
The risk manager is commissioned by management with risk management for the company. They coordinate methodology, approach, risk team, data quality and situational picture.
Their task is to enable steering capability in risk management: management receives a reliable, current and decision-ready view of the risk situation.
Risk owner
The risk owner takes on the functional modeling responsibility for the risks assigned to them. They contribute the knowledge of their business unit and ensure that threats, consequences and barriers are described realistically.
Risk owners are decisive for the quality of risk management: good risk models emerge where methodology and subject-matter expertise come together.
Risk team
The risk team consists of people delegated from the business into the risk management organization. It links central methodology with distributed expertise.
In the portal, the risk manager, risk owners, business unit leads and other stakeholders work in the same system – with clear roles, responsibilities, approvals and evidence.
Operational risk management
Operational risk management means that risks are not only described and assessed, but actively managed through concrete measures.
In the BowTie Portal this happens through barriers managed as tasks. Every task has responsible parties, deadlines, status, costs, impact, approval and history. This turns risk analysis into an ongoing management process.
Excel risk list vs. BowTie model
An Excel risk list often records risks as individual table rows. The BowTie model additionally shows the relationships: which threats drive the risk? Which consequences arise? Which barrier acts where? What costs and benefits are associated with them?
This produces traceable risk models instead of isolated entries. The results become evaluable, manageable and reportable.
Supplier risks
Suppliers bring their own risks into the organization through products, services, infrastructure, data access and dependencies. In the BowTie Portal, supplier risks can be modeled using the same logic as internal risks.
This integrates threats, consequences, barriers, risk values and measure status into the company-wide situational picture.
Risk register
The risk register is the structured collection of all relevant risks. In the BowTie Portal, this becomes more than a list: every risk has a model structure, threats, consequences, barriers, assessments, responsibilities and history.
This turns the risk register into a manageable data foundation for risk inventory, situational picture and management decisions.
Risk profile
The risk profile describes the current overall risk exposure of an organization, a business unit, a process, a plant or a supplier.
Over time, the risk profile shows whether barriers are effective, whether new threats are emerging, and whether the risk situation is improving, stable or becoming more critical.
Internal Control System (ICS) and Enterprise Risk Management (ERM)
ICS stands for Internal Control System. ERM stands for Enterprise Risk Management, i.e. company-wide risk management. The BowTie Portal supports both perspectives: controls are modeled as barriers, risks are assessed across business units and consolidated into a situational picture.
This allows operational controls, risk assessments, responsibilities and management reports to be managed in a shared structure.
Threats – 10 dimensions
For structured recording, threats can be organized into dimensions: organizational risks, process risks, laws and standards, non-IT technological risks, information technology, personnel risks, partner/customer/infrastructure risks, force majeure and natural events, human misconduct, and financial risks.
These dimensions help to search systematically during the risk inventory and avoid overlooking significant triggers.
Consequences – typical impact classes
Consequences can be organized into impact classes, for example claims for damages, reputational damage, repair/replacement, inability to deliver, quality problems, loss of market price, customer loss, regulatory violation, breach of contract, health impacts, payment default, loss of production capacity, loss of human resources, or inefficient production.
Impact classes support the assessment of consequence costs and the prioritization of reactive barriers.
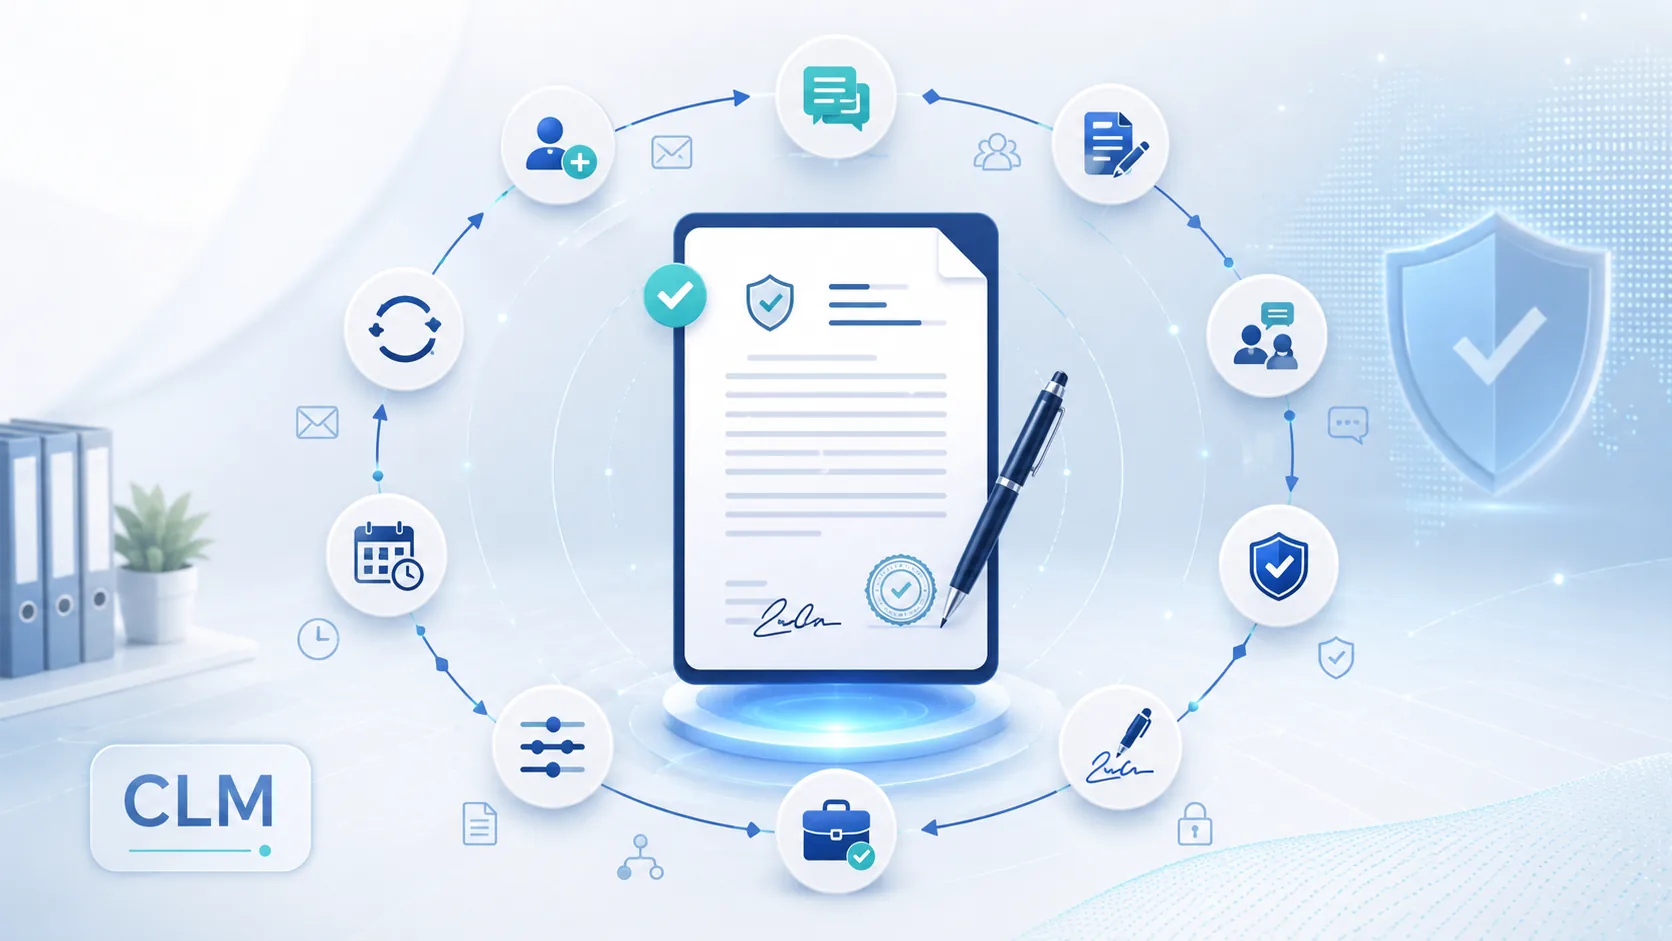
factory Contract Management / CLM.
Key takeawayCLM is contract management as an active lifecycle – with clear steering of creation, review, approval, deadlines, changes, renewals and terminations.
Contract Lifecycle Management as a digital contract control center – with a clear USP: the contract becomes an active digital partner. It monitors deadlines, reports changes, shows value and risk on the dashboard, and replaces email ping-pong with a virtual round table. Regulatory requirements such as DORA or the CRA, along with additional contract components and addenda, are integrated into the contract process in a structured way.
Go to product page: CLM Contract Management ↗
From contract folder to active contract control center.
The factory Contract Portal manages contracts as digital processes. Request, signing, changes, termination, deadlines, communication and documents are brought together in a contract file and steered by the Workflow Engine.
The digital contract file as a management object.
Every contract is managed with its data, documents, deadlines, values, risks, roles and complete history. This creates clear views for customers, employees and contract managers.
The USP: a virtual round table for joint contract work.
The special USP of the factory Contract Portal: the contract is far more than a PDF file – it becomes an interactive, manageable digital partner. At the virtual round table, contract owners, business units and contract parties work together on the case – they coordinate content page by page, exchange documents in a controlled way, receive role-based read rights, and document approvals directly in the digital contract file.
Virtual round table for joint contract work
The virtual round table is the central USP of the factory Contract Portal: contracts are developed, reviewed and approved together at the virtual round table.
Three or four contract parties can coordinate content page by page, add comments, provide documents, receive targeted read rights, use downloads and document approvals. This creates a transparent, audit-ready contract process with clear file versions and transparent responsibilities.
The contract as an active digital partner
The particular USP is this: the contract is far more than a PDF file – it becomes an interactive, manageable digital partner.
It monitors its own deadlines, reports changes, warns in good time before renewal, termination or expiry, shows value and risk on the contract dashboard, and steers access, documents, approvals and communication through clear roles and rights. This makes contract management fully active, secure and easy to control.
Page-by-page coordination & controlled document exchange
At the virtual round table, contract content is reviewed, commented on and coordinated page by page – traceably, directly on the case.
Documents and evidence are provided in a controlled way; emails can be filed alongside in a structured manner for auditable documentation. Every party sees and downloads exactly what they are authorized to, and decisions are recorded as approvals in the digital contract file's history.
Contract dashboard: value, risk, deadlines and missing addenda
The contract owner sees at any time on the dashboard which contracts are critical, which deadlines are coming up, which changes are in progress, which addenda are missing, which risks exist, which contract value is affected, and which party still needs to respond.
This actively prioritizes and steers the contract portfolio.
Regulation as a contract component: DORA, CRA, addenda
Regulatory requirements such as DORA (Digital Operational Resilience Act), the CRA (Cyber Resilience Act) or other addenda are integrated into the contract process as structured contract components with associated deadlines, evidence and tasks.
This keeps compliance obligations secure, traceable and dashboard-ready – and it immediately becomes visible if an addendum or piece of evidence is missing.
CLM – Contract Lifecycle Management
CLM stands for Contract Lifecycle Management.
This refers to the end-to-end digital steering of a contract across its entire lifecycle.
This includes request, registration, drafting, negotiation, approval, signing, term, change, deadline monitoring, termination, archiving and history.
In the factory Contract Portal, CLM is implemented as a guided digital process: the contract is an active case with status, rules, roles and next steps.
Contract control center
A contract control center applies the control-center principle to contract management.
Contract data, documents, deadlines, tasks, events and communication are centrally brought together and continuously monitored.
This creates a management view over the entire contract portfolio: which contracts are running? Which deadlines are approaching? Where is action needed? Which role is responsible? The control center makes contract management manageable.
Digital contract process
A digital contract process guides participants step by step through request, signing, change or termination.
It combines forms, documents, approvals, authentication, deadlines, notifications and history.
For customers, this creates a clear process.
For the client, process security results because every step is tied to a role, rule and documentation.
Contract lifecycle
The contract lifecycle describes the phases of a contract from the first request to its termination.
Typical phases include initiation, review, signing, term, change, deadline monitoring, renewal, termination and archiving.
CLM makes these phases transparent and manageable.
Digital contract file
The digital contract file bundles all information about a contract: contract data, contact details, responsible parties, documents, deadlines, values, risks, internal notes, communication and history.
It is the central information space for the respective contract and the basis for workflow, evaluation and traceability.
Contract portfolio
The contract portfolio is the totality of all running, prepared, changed, terminated or archived contracts.
With large portfolios, overview becomes a management topic: the contract control center condenses individual cases into status, deadlines, responsibilities, risks and priorities.
Contract request
The contract request is the starting point of a contract process.
Prospects or customers enter data, choose a contract type, or request a contract to be signed.
In the portal, this becomes a structured case with status, responsible role and next steps.
Registration in the contract portal
Registration creates digital access to the contract process.
It assigns users, contact details, roles and permissions to the contract or contract space.
This allows the portal to specifically manage which information is displayed and which actions are possible.
Contract signing in the portal
Signing a contract in the portal combines contract templates, customer data, approvals, documents and authentication.
The signing is documented and managed as a digital process: who agreed? Which version was valid? When was it signed? Which deadlines start from it?
Contract change
A contract change is a regulated process during the term.
Change requests, new data, additional documents, approvals and decisions are captured in the portal and stored in history.
This keeps it traceable which contract version was changed for which reason.
Termination in the portal
Termination is managed as its own contract process.
The portal can incorporate termination deadlines, templates, roles, confirmations and authentication.
This makes mutual terminations transparent, timely and traceable.
Renewal and reminders
Many contracts renew automatically or need to be reviewed in good time.
Reminders ensure that contract managers are informed ahead of relevant deadlines.
This turns a deadline into a managed work step.
Workflow Engine
The Workflow Engine is the portal's central steering logic.
It evaluates status, deadlines, roles, rights, events and object information together and derives the appropriate next step: notification, review, approval, reminder, escalation or completion.
Status management
Status management means that every contract process has a clear processing state.
Examples include requested, under review, approved, active, change requested, termination submitted, or archived.
The status determines which actions are possible and which role is responsible.
Deadline monitoring
Deadline monitoring makes dates in contract management actively manageable.
Termination deadlines, processing deadlines, reminders, evidence dates and approvals are stored, monitored and linked with notifications or tasks.
WatchDog in contract management
A WatchDog monitors defined events, deadlines or states.
In the contract portal it can flag when a termination deadline is approaching, an upload has arrived, an approval is pending, or a customer action triggers a next step.
Queueing system
A queueing system manages the dispatch of messages in a structured, controlled way.
Especially with customer groups or larger contract portfolios, it helps deliver emails in a time-ordered, traceable and reliable manner.
Historization
Historization means that relevant changes and events are stored in a traceable manner.
This includes data changes, document uploads, status changes, communication, approvals and deadline decisions.
History creates transparency and auditability.
Role-based view
A role-based view shows users exactly the information and functions they are authorized for.
External customers, internal employees and contract managers get different views of the same contract case.
Permission system
The permission system defines who may use which contract spaces, files, documents, fields and actions.
It combines roles, rights and contract context, forming the basis for data protection, confidentiality and clear responsibilities.
Two-factor authentication
Two-factor authentication increases the security of binding actions.
In addition to normal access, a second factor is requested.
This is especially relevant when signing, terminating, or making important contract changes.
Whitelist concept
With the whitelist concept, only explicitly approved file formats are accepted.
For document exchange this is a robust security principle: only what is vetted and needed is allowed; unknown or unapproved formats are rejected.
Document upload
Document upload allows customers and internal roles to provide documents directly at the contract.
Uploads are assigned to the case, checked, stored in history, and can trigger workflows – for example, a notification to the contract manager.
GDPR-compliant contract steering
GDPR-compliant contract steering means that personal data, access, documents and communication content are processed in a role-based, traceable and purpose-bound manner.
The portal supports this through permissions, history and structured processes.
Contract space
A contract space is a structured area for specific contract types, customer groups, areas of responsibility or processes.
It bundles the appropriate information, rights, documents and functions for the respective group.
Contract type
The contract type describes the functional category of a contract.
It can determine which data fields, documents, deadlines, templates, roles and workflows apply to a case.
Customer communication in the portal
Customer communication in the portal means that emails, notifications and messages are generated, sent and stored in history directly at the contract.
This keeps communication part of the contract file.
Internal note
Internal notes supplement the contract file with functional remarks, assessments or processing comments.
They are visible to authorized internal roles and support processing without media breaks.
Contract value and risk
Contract value and risk help prioritize contract cases.
High contract values, critical terms, particular customer segments or risky changes can be weighted more heavily in steering.
DMS variant for contracts
The contract portal is a specialized DMS variant for contracts.
It manages documents in an integrated way, connecting them to contract data, deadlines, roles, communication, status and workflow.
This turns document filing into active contract management.
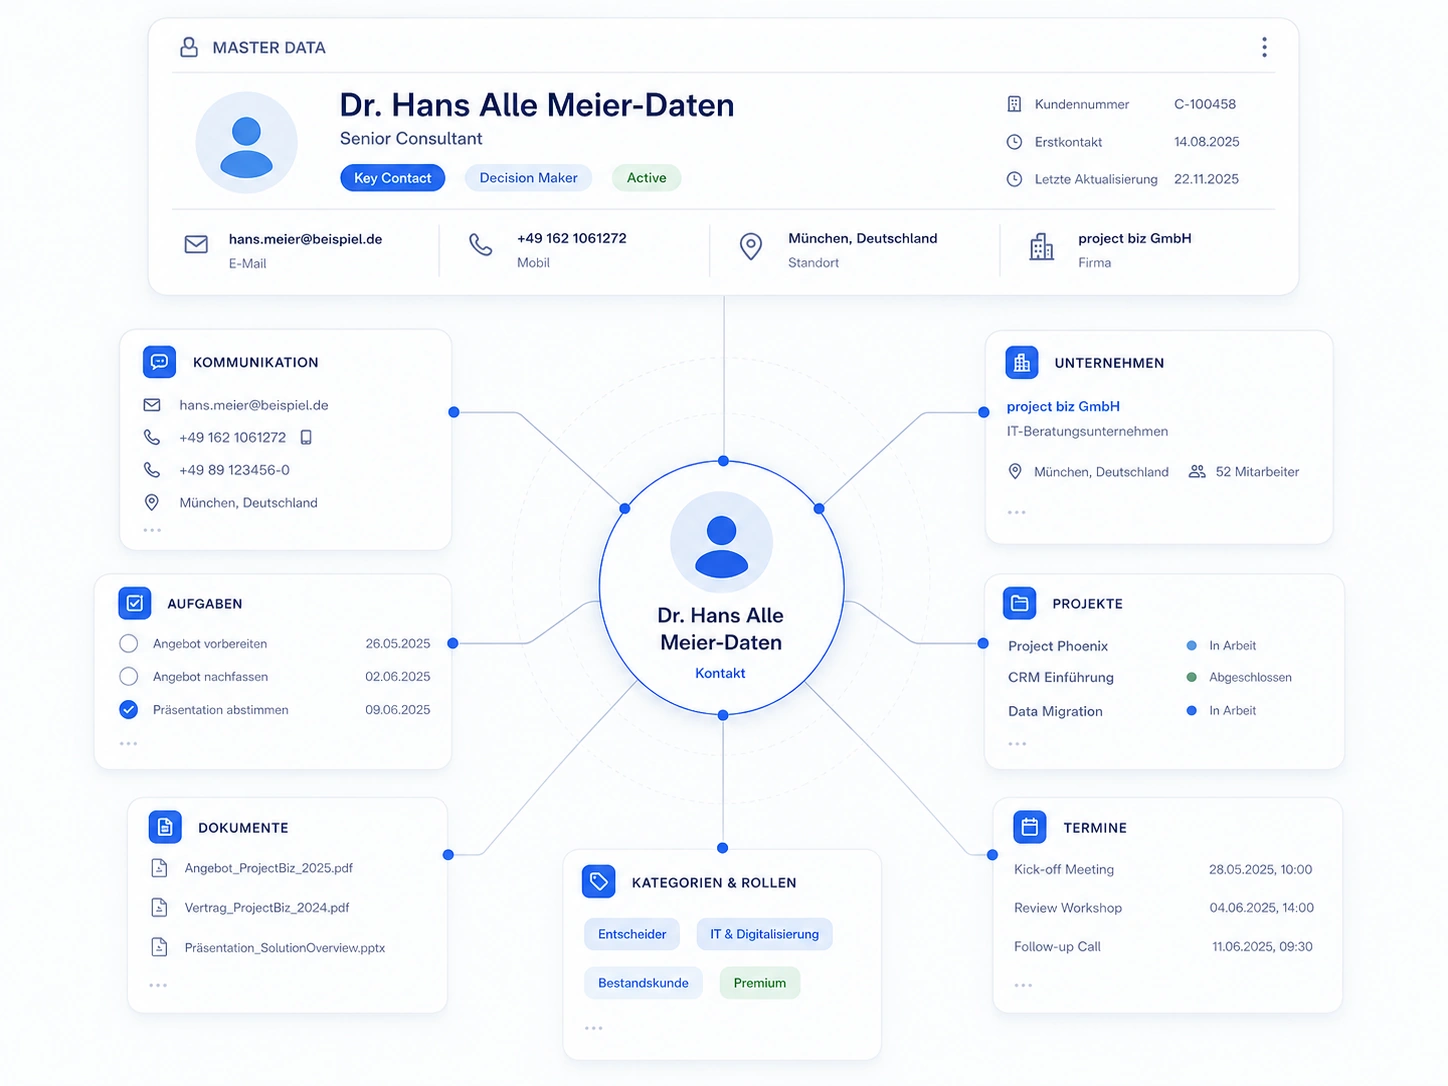
factory CRM Contact Management.
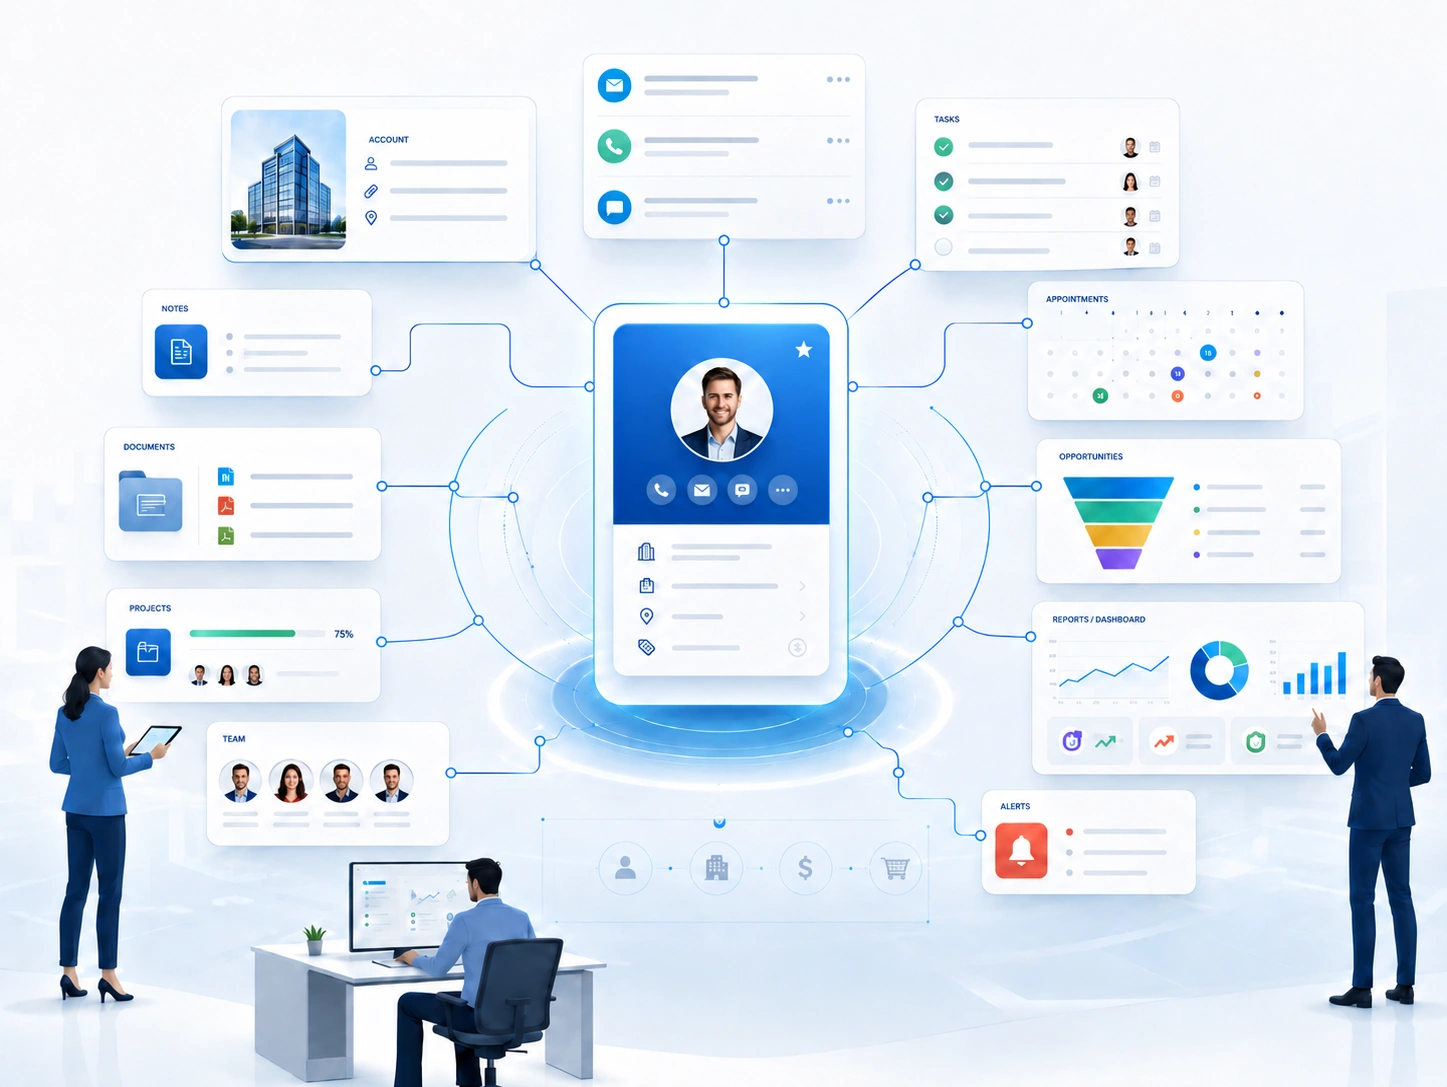
Key takeawayThe factory CRM puts the person at the center as a living object – with roles, relationships, skills, deadlines and delegations, protected by a three-dimensional rights concept of person, attribute and owner.
CRM as a contact control center with a clear USP: the person at the center. A person is managed as a living object with roles, relationships, responsibilities, assistants, skills, deadlines, documents, delegations and development paths. Confidentiality is secured by the three-dimensional factory rights concept spanning person, attributes and owner rights.
Go to product page: CRM Contact Management ↗
The USP: the person at the center.
The factory CRM is a contact control center for the person in the full reality of their professional life. A person is mapped with roles, relationships, responsibilities, assistants, skills, deadlines, documents, delegations and development paths. This creates a genuine overall picture of the person within the company, the project, sales, the organization and the process.
The three-dimensional factory rights concept.
Confidentiality is precisely managed across three levels. Roles, attributes and owner rights determine exactly who may see, change, pass on, or is responsible for something.
What is the factory CRM as a contact control center?
The factory CRM is a contact control center that maps the person in the full reality of their professional life. A person is managed with name and contact details and, beyond that, with roles, relationships, responsibilities, assistants, skills, deadlines, documents, delegations and development paths.
This creates a genuine overall picture of the person within the company, the project, sales, the organization and the process – as a manageable relationship and responsibility object.
The person as a living object
In the factory CRM, the person is at the center – as a living object rather than a mere data record. It becomes visible who a person really is, what functions they perform, what responsibility is attached to them, and which processes depend on them.
Roles, relationships, appointments, delegations and tasks form a shared overall picture. This actively supports succession, knowledge transfer, responsibility handover and personal care.
Multiple roles and facets of a person
A person has many facets: they can be a manager and, at the same time, an employee, a project owner, a customer, a supplier, an auditor, an apprentice, a skill holder or a knowledge holder. Through an assistant, calls, appointments and coordination work realistically.
The CRM brings these roles together in one person and shows the appropriate context for each process – with a clean, duplicate-free structure.
Succession, skills and knowledge transfer
People take on roles, hand off responsibilities, build skills or leave the company due to age. The factory CRM makes these relationships visible and manageable.
On a role change, departure or responsibility handover, the system shows which skills, tasks, relationships and responsibilities are being transferred. This turns the CRM into a succession, skill and responsibility control center.
The three-dimensional rights concept
The three-dimensional factory rights concept secures confidentiality across three levels: access to the person as a whole, access to individual attributes, and owner rights per record.
Roles, attributes and owner rights precisely control who may see a person, change an attribute, pass on information, or be responsible for a record.
Dimension 1: access to the person as a whole
The person themselves is visible in a role-appropriate way. Some users see the full contact, others see a suitable excerpt – each exactly within the scope of their permission.
This gives every role the appropriate view of the person, tailored to task and responsibility.
Dimension 2: access to individual attributes
Even within a person, individual pieces of information remain finely controllable. Phone number, private contact details, assistant, roles, skills, assessments, documents or sensitive notes are visible, readable or editable depending on the role.
This gives every role exactly the attributes their task requires.
Dimension 3: owner rights per record
Every record has an owner who maintains, edits and passes it on comprehensively. When handed off to a next owner, the owner rights transfer along with it.
This creates clear responsibility for maintenance, currency and personal care of every person.
Benefits of owner logic & self-steering
The owner dimension makes the CRM particularly strong: the owner sees when they last worked on a person, which activities are open, and where attention is needed. Personal reminders keep important people top of mind.
This supports both central control and each owner's self-steering: every owner actively manages their contacts, relationships, tasks and reminders.
factory Dashboard Controlling.
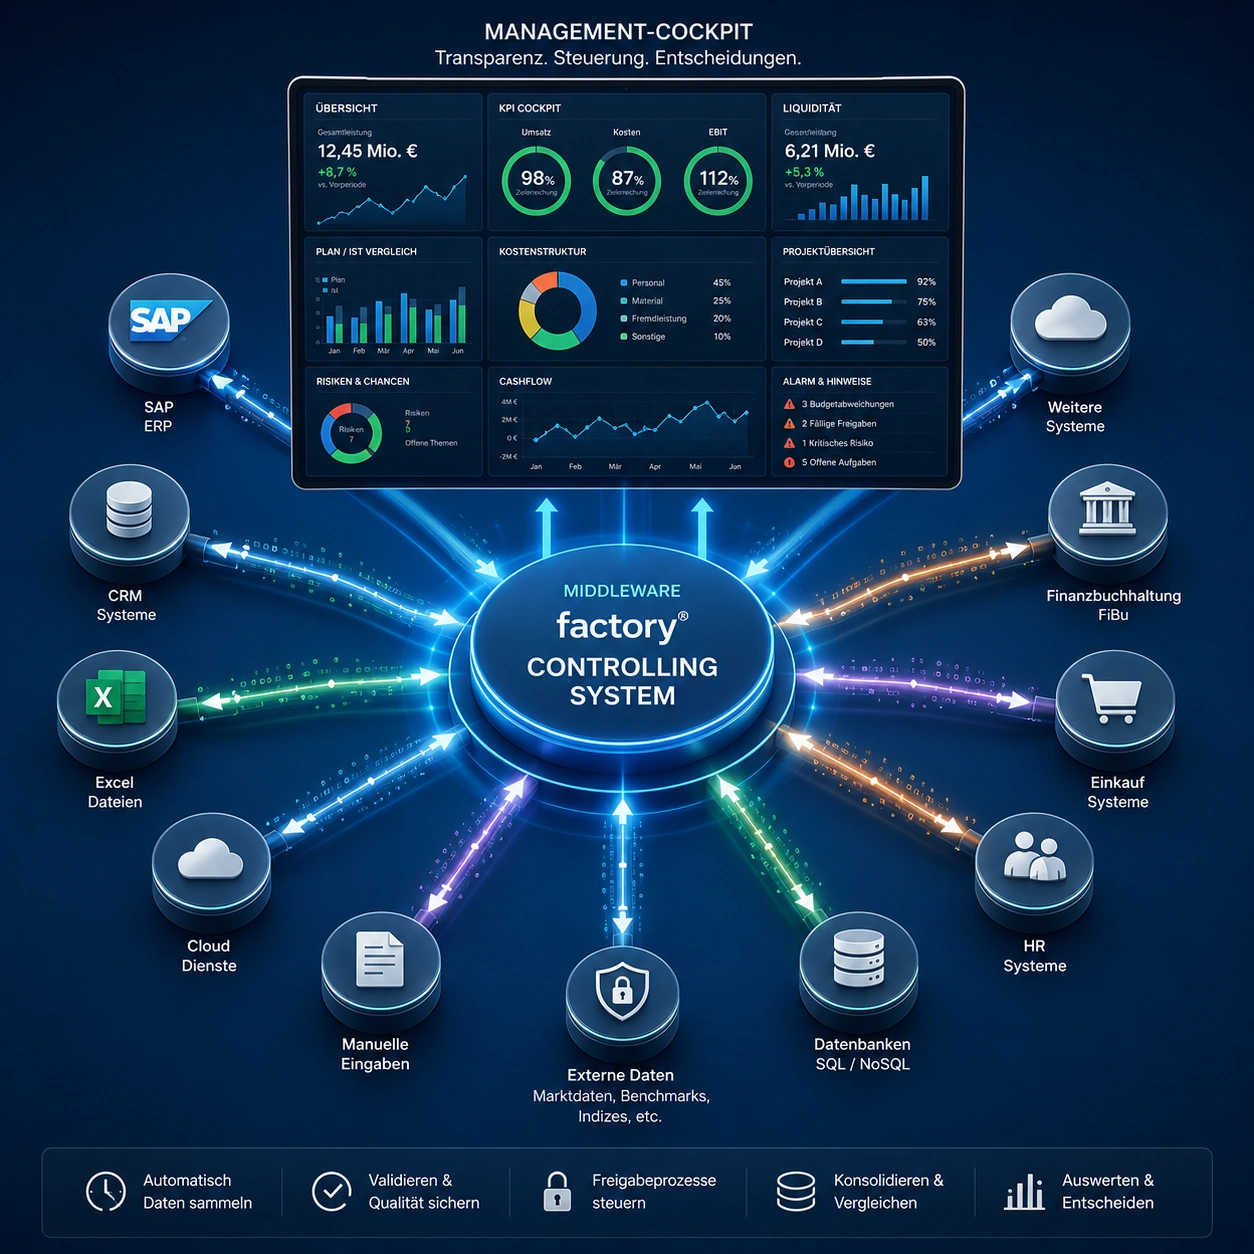
Key takeawayThe factory Controlling Cockpit turns scattered source data into a binding steering process – with automatic data retrieval, functional approval, cKPI calculation, a management cockpit, and audit-ready history.
The factory Dashboard Controlling is the data hub between source systems, business units and the management cockpit. Data from ERP, finance, HR, planning and other systems is automatically brought together, checked, commented on and approved by those responsible. The USP is a binding controlling process: automatic data retrieval, functional approval, cKPI calculation, management cockpit, regular review meetings, measures and history. The result is a cockpit everyone trusts.
Go to product page: Dashboard Controlling ↗
The USP: a data hub with an approval process.
Data from ERP, finance, HR, planning and other systems is automatically brought together, checked, commented on and approved by those responsible. Only approved values are consolidated into reliable management metrics. This creates a binding controlling process rather than pure data visualization.
The steering cycle.
The steering cycle links data collection, evaluation and management response with the operational responsibility of department heads – starting from the cut-off date.
What is the factory Dashboard Controlling?
The factory Dashboard Controlling is the data hub between source systems, business units and the management cockpit. Data from ERP, finance, HR, planning and other systems is automatically brought together, checked, commented on and approved by those responsible.
The particular USP is a binding controlling process: automatic data retrieval, functional approval, cKPI calculation, management cockpit, regular review meetings, measures and history. This creates a cockpit everyone trusts.
What does the data hub deliver?
The data hub retrieves data from various source systems, makes it available to the respective owners for review in the department cockpit, and consolidates approved values in the management cockpit.
This creates a reliable overview of plan, actual, variances, measures and development – turning scattered company data into a checked, approved and decision-ready steering base.
How does the approval process work?
Metrics are determined, functionally reviewed and, if needed, corrected, commented on and approved by the responsible party. Every department owner sees exactly their own data and bears responsibility for the approval.
Only approved values are consolidated in the management cockpit. This means management trusts the figures, because the business units approved them themselves.
Review meetings, measures and history
Every cycle culminates in a review meeting: management discusses the situational picture, derives measures and anchors them in the next cycle. The cycle is then stored in history.
Historization records every state in an audit-ready way and makes developments comparable across years. Every change stays traceable – who, when and why.
What is the steering cycle?
The steering cycle links data collection, evaluation and management response with the operational responsibility of department heads. Starting from the cut-off date, departments enter their data by x+15, evaluation into cKPIs happens by x+20, and management responds with decisions and measures by x+25.
The shorter the distance from cut-off date to response, the more proactive the steering.
What does proactive steering mean?
Management steers its area of responsibility against defined goals. The cockpit reports target deviations early, so counter-measures can be taken in good time.
The basis is current metrics: an overview of metrics affecting success, all key data at a glance, and information evaluated in overall context.
What are cKPIs?
cKPIs are combined metrics that condense the status, risk and forecasts of the key success factors. Examples include EBIT, revenue, employee utilization and product costs.
The data foundations come from operational systems; historization allows comparison with previous years.
Budget risk and schedule risk as a metric
Budget and schedule risk combine ongoing measures on a value-weighted basis. A positive budget risk indicates a possible overrun of planned costs; a schedule risk indicates that measures may only be booked the following year.
This creates targeted risk management: management recognizes early where resources are tied up and where counter-measures make sense.
User concept: top-level and drill-down
The cockpit offers a top-level view for management and a drill-down to the level of business unit heads, supplemented with external information. Every level sees exactly its own metrics and bears responsibility for its own data. This strengthens each unit's ownership.
factory Data Visualization Portal.
Key takeawayThe factory Data Visualization Portal makes technical bulk data instantly visible – as time series, heat maps, 3D models, maps and management cockpits with drill-down to a single value.
The particular advantage of the factory base software lies in the fast visual processing of differently structured bulk data. Existing data sources are imported quickly, linked to objects and delivered as meaningful 3D models, map views, dashboards and drill-down analyses.
Go to product page: Data Visualization Portal ↗
The USP: making bulk data visible fast.
Differently structured bulk data is imported quickly, linked to objects and delivered as meaningful models, maps, dashboards and drill-down analyses. Technical detail data becomes clear patterns, profiles and situational pictures.
Two particularly powerful formats.
The focus is on two visualization forms that make technical questions instantly visible.
What does the Data Visualization Portal deliver?
The portal imports technical bulk data, stores it in history, links it with objects and presents it as interactive diagrams, heat maps, 3D models, dashboards and management situational pictures.
Its particular advantage is the fast visual processing of differently structured bulk data: detail data becomes clear patterns, profiles and situational pictures.
Why is the RLM example so telling?
A single load-profile meter already delivers 96 values per day at 15-minute intervals. Across months, meters or locations, large volumes of data arise whose patterns become especially quick to recognize visually.
This is exactly where visualization delivers its benefit: it makes load peaks, operating times and anomalies visible at a glance.
Import, historization, visualization and monitoring
The workflow is end to end: data is imported, stored in history, visualized and monitored. Historization allows the comparison of time periods, objects and references.
This keeps every development traceable and comparable across days, weeks and months.
Which data sources can be connected?
Typical sources include CSV, Excel, database exports, REST APIs, specialist systems, SCADA systems, ERP systems, GIS systems, asset management systems, IoT platforms, and meter and sensor data sources.
Existing data sources are imported quickly and linked to objects.
WatchDog: monitoring thresholds and events
WatchDog functions monitor threshold values, missing readings, notable load peaks or defined events. This generates alerts, review tasks, reminders or push notifications.
This means anomalies are actively reported and lead directly to appropriate actions.
Time series: load curves & measurement trends
The trend over time remains the basis for detailed analysis, plausibility checks and drill-down – for electricity, gas, water, sensor and process values.
Minimums, maximums, averages and peaks become visible; time periods, objects and references can be compared.
Heat map: consumption patterns by time of day
Heat maps show intensities, repetitions and time windows especially fast: daily, weekly and monthly patterns, operating hours, weekends and shift patterns.
Notable time periods and recurring load peaks stand out immediately.
3D model: the 24-hour slice
Every day is displayed as its own profile over 24 hours. Placed one behind the other, these daily profiles form a spatial consumption object.
This makes load peaks, operating hours, weekly rhythms, plateaus and outliers stand out clearly – changes over time are instantly recognizable.
Management cockpit & drill-down
Technical detail data is condensed for the business unit and management into steering-relevant information: top consumers, trends and status tiles.
The drill-down leads from the overall picture down to a single value and sets priorities for operations, controlling and management.
Map view: geographic data & sales example
Geographically structured data appears as overview points on a map and can be directly linked with locations, objects, customers, plants or service cases.
Sales example: a map section shows a planned customer visit along with the prospects in the defined radius. This makes additional sales contacts, clarification calls and on-site visits easier to plan.
Which technical business processes can be visualized?
Suitable processes include network operations, asset management, maintenance, incident management, control-center processes, plant monitoring, inspection and audit processes, facility management, production, quality management, technical evidence management and field service.
Wherever measurements, condition data, fault reports, inspection reports, maintenance data or location information arise, visualizations make patterns, clusters, deviations, priorities and the need for action visible.
factory DMS & Document Control Center.
Key takeawayDMS-biz turns documents into an active document control center – with search, rights, deadlines, approvals, versioning and traceable history.
DMS-biz turns established Explorer, drive and SharePoint structures into a manageable document control center: with search continuity, role rights, deadlines, versioning, approvals, a library copy, interactive use and traceable decision history.
Go to product page: DMS & Document Control Center ↗
From file storage to an active document control center.
DMS-biz takes over existing filing structures and supplements them with functional search keys, rights, status and workflows. Familiar navigation is preserved while documents become bindingly manageable.
The document lifecycle in the portal.
Processing, review, approval, use, reminders and historization are managed as an end-to-end process. This keeps it visible which version is valid and which decision bases existed at which point in time.
What is a DMS system?
A DMS system is software for the structured management, control, versioning and approval of documents.
Unlike simple filing, documents gain additional information: status, rights, responsible parties, deadlines, versions, comments, approvals and history.
DMS-biz extends this basic logic into a document control center for organizations where documents need to be bindingly managed.
What is DMS-biz?
DMS-biz is the factory document management portal for SMEs, public authorities and municipal organizations.
It turns existing Explorer, drive and SharePoint structures into a manageable document organization with search continuity, role rights, deadlines, workflows, versioning and audit-ready decision history.
Document control center
A document control center applies the control-center concept to documents.
Documents are actively managed: with valid version, responsibility, status, deadline, approval, security level, comments and decision history.
The document control center makes it visible what is valid, what is open, who is responsible and which decision was made on which basis.
Document management software
Document management software supports the structured filing, searching, editing, approval and tracking of documents.
DMS-biz combines these functions with functional case management: rights, deadlines, versions, approvals, reminders and history are managed directly at the document.
ECM alternative
ECM stands for Enterprise Content Management and refers to large systems for managing company-wide content.
DMS-biz is positioned as a pragmatic ECM alternative: quick to introduce, role-based, focused on business processes, and especially suited to organizations that want to build a manageable document process from existing filing structures.
Click-path simulation
Click-path simulation virtually recreates the previous folder logic.
Users can continue navigating via familiar paths even though documents in the DMS are already managed with additional search keys, rights and workflows.
This preserves familiar orientation while modernizing document management.
Search continuity
Search continuity means that existing search paths remain usable even after the DMS is introduced.
The familiar file path, the old folder name, or familiar naming conventions are preserved as structured search attributes.
In parallel, new search options emerge via business unit, document type, project, asset, contract party, security level or date.
Search key
A search key is a structured attribute used to find and assign documents.
Examples include file name, old path, author, date, document type, business unit, project, asset, contract party, case, security level or validity.
DMS-biz can combine several attributes during saving or migration and thus build an intelligent search logic.
Metadata
Metadata is descriptive information about a document.
It answers questions like: who created the document? Which case does it belong to? Which document type is it? Which deadline applies? Which security level is set?
Metadata makes documents manageable and significantly easier to find.
OCR in PDF documents
OCR means text recognition in scanned documents or PDFs.
OCR can make content machine-readable. This allows documents to be found via recognized
text content and functional terms as well.
The "OCR-based AI integration" module is factory's next development.
Working copy
The working copy is the working version of a document.
It can be changed, commented on, reviewed and prepared for approval by authorized persons.
The working copy is kept separate from the approved library copy so internal drafts are not confused with valid versions.
Library copy
The library copy is the approved, valid version of a document.
Authorized users and external partners access this version. Internal drafts, working states and coordination stay separate from it.
This makes it clear at all times which version is bindingly valid.
Library version
The library version refers to the currently approved version of a document in the DMS library.
It is the official working and evidence basis for authorized users.
Versioning
Versioning means that changes to documents are traceably managed as versions.
This keeps it recognizable which version was valid when, what was changed, and which version formed the basis of a decision.
Approval workflow
An approval workflow steers a document's path from processing through review and decision to publication as a valid version.
DMS-biz links approvals with roles, responsibilities, deadlines, reminders and history.
Valid version
The valid version is the currently approved version of a document.
DMS-biz makes it visible which version is valid, whether a newer draft exists, and which version was used at which point in time.
Subscription to valid documents
A document subscription informs authorized users about changes to relevant documents.
When a new valid version is approved, subscribers can be notified in a targeted way.
Role-based rights
Role-based rights determine who may view, edit, approve, comment on or forward a document.
DMS-biz can combine internal roles, external partners, persons, security levels and document status.
Partner roles
Partner roles enable external access to defined documents and library copies.
External partners only see the content intended for their role. Internal working versions remain protected.
Security level
A security level describes how sensitive a document is.
Typical levels include internal, confidential or strictly confidential. The security level can govern rights, visibility, export behavior and the security stamp.
Security stamp
A security stamp marks documents with the appropriate confidentiality level when saved or exported to PDF.
This keeps the protection context visible even outside the portal – for example on printed or sent PDFs.
Source document
A source document is the original or working file from which an approved version, a PDF or a result document is created.
DMS-biz can manage rights for source documents and library copies separately.
Document deadline
A document deadline is a date directly linked to a document.
Examples include contract end, notice period, certificate expiry, inspection interval, update obligation or a reminder.
DMS-biz monitors such deadlines and informs the responsible roles in good time.
Reminder
A reminder ensures that a document is reviewed or processed again at a defined point in time.
It is important for certificates, contracts, permits, security documents, inspection reports or evidence that needs regular updating.
Escalation
An escalation is triggered when a task, deadline or approval is not completed in time.
DMS-biz can then generate a reminder, warning or forwarding to a higher role.
Interactive use
Interactive use means that an approved document is sent to subscribers, that the responsible party is notified of a deadline, and so on.
Authorized users can add questions, comments, confirmations or tasks directly at the document. The responses remain assigned to the document.
Document as a communication object
A document becomes a communication object when comments, questions, tasks, confirmations and decisions are linked directly to it.
Communication stays traceable at the document.
Historization
Historization means that relevant changes, versions, approvals, comments and decisions are permanently stored in a traceable way.
This allows later proof of which information was valid at which time and who made which decision.
Decision evidence
Decision evidence documents the basis on which a decision was made.
This includes valid document versions, additional information, comments, approvals, dependencies and responsible parties.
Audit-ready documentation
Audit-ready documentation means that information is kept complete, traceable, unaltered and auditable.
DMS-biz supports this through versioning, historization, rights, approvals and structured decision trails.
Digital file management
Digital file management bundles documents, metadata, deadlines, communication, status and history into a functional case.
This creates files for committees, construction and permitting procedures, utility connections, contracts, suppliers, security or plants.
Compliance documentation
Compliance documentation covers evidence, requirements, contracts, inspection reports, approvals and decision trails needed for internal or external audits.
DMS-biz helps keep this documentation structured, current and traceable.
DMS-biz in depth: filing check, requirements and auditable document management.
Additional know-how modules follow from the product page: DMS-biz answers typical requirements from public authorities, municipal utilities and SMEs – from established folder structures to differentiated partner rights, deadlines, security stamps and complete decision evidence.
DMS-biz takes over Explorer, drive and SharePoint structures through migration. The previous file path remains as a search and navigation attribute; additional new search keys and DMS functions emerge on top.
When saving or migrating, search attributes such as path, author, document type, business unit, asset, project, security level, date or contract party are combined. This turns the file into a functionally findable document object.
DMS-biz separates the working copy from the library copy. Internal working states stay in the working area; external partners receive defined roles with access to approved library copies.
Documents carry their own dates: contract end, notice period, certificate expiry, inspection interval, update obligation or reminder. Responsible roles are informed in good time; escalation occurs if needed.
The security stamp transfers the protection context to the document, for example "Internal", "Confidential" or "Strictly Confidential". The confidentiality status remains visible even outside the portal.
DMS-biz stores versions, approvals, additional information, comments and document dependencies in history. For every result document it remains traceable which source documents formed the basis and which decision was made.
Filing check
The filing check is a structured self-test for organizations: are documents found quickly, is the valid version recognizable, are rights cleanly set, are approvals transparent, and do decisions stay explainable?
The five questions show whether an existing filing system already functions as a reliable document control center or should be extended with DMS-biz.
Document lifecycle
The document lifecycle describes a document's path from draft and processing through workflow, approval, library copy, validity, interactive use and historization.
DMS-biz makes these phases visible and manageable.
OCR in PDFs
OCR stands for text recognition. In scanned or image-based PDFs, readable text can be recognized and made usable for search.
This makes content findable that would otherwise be difficult to access in a plain file archive.
Validity management
Validity management ensures that validity periods, expiry dates, inspection intervals and update obligations are managed directly at the document.
This means documents are both stored and actively monitored.
Certificate expiry
Certificate expiry is the end of validity of a piece of evidence, for example a security, quality or supplier certificate.
DMS-biz can monitor such expiry dates and trigger timely reminders.
Inspection interval
An inspection interval defines the rhythm in which a document, piece of evidence, contract or technical record should be reviewed.
DMS-biz links inspection intervals with responsible parties, reminders and history.
Regulatory evidentiary capability
Regulatory evidentiary capability means that an organization can traceably prove to auditors or regulators which documents, versions, approvals and decisions existed at a given point in time.
DMS-biz supports this through historization, versioning, rights and decision trails.
factory Facility Management.
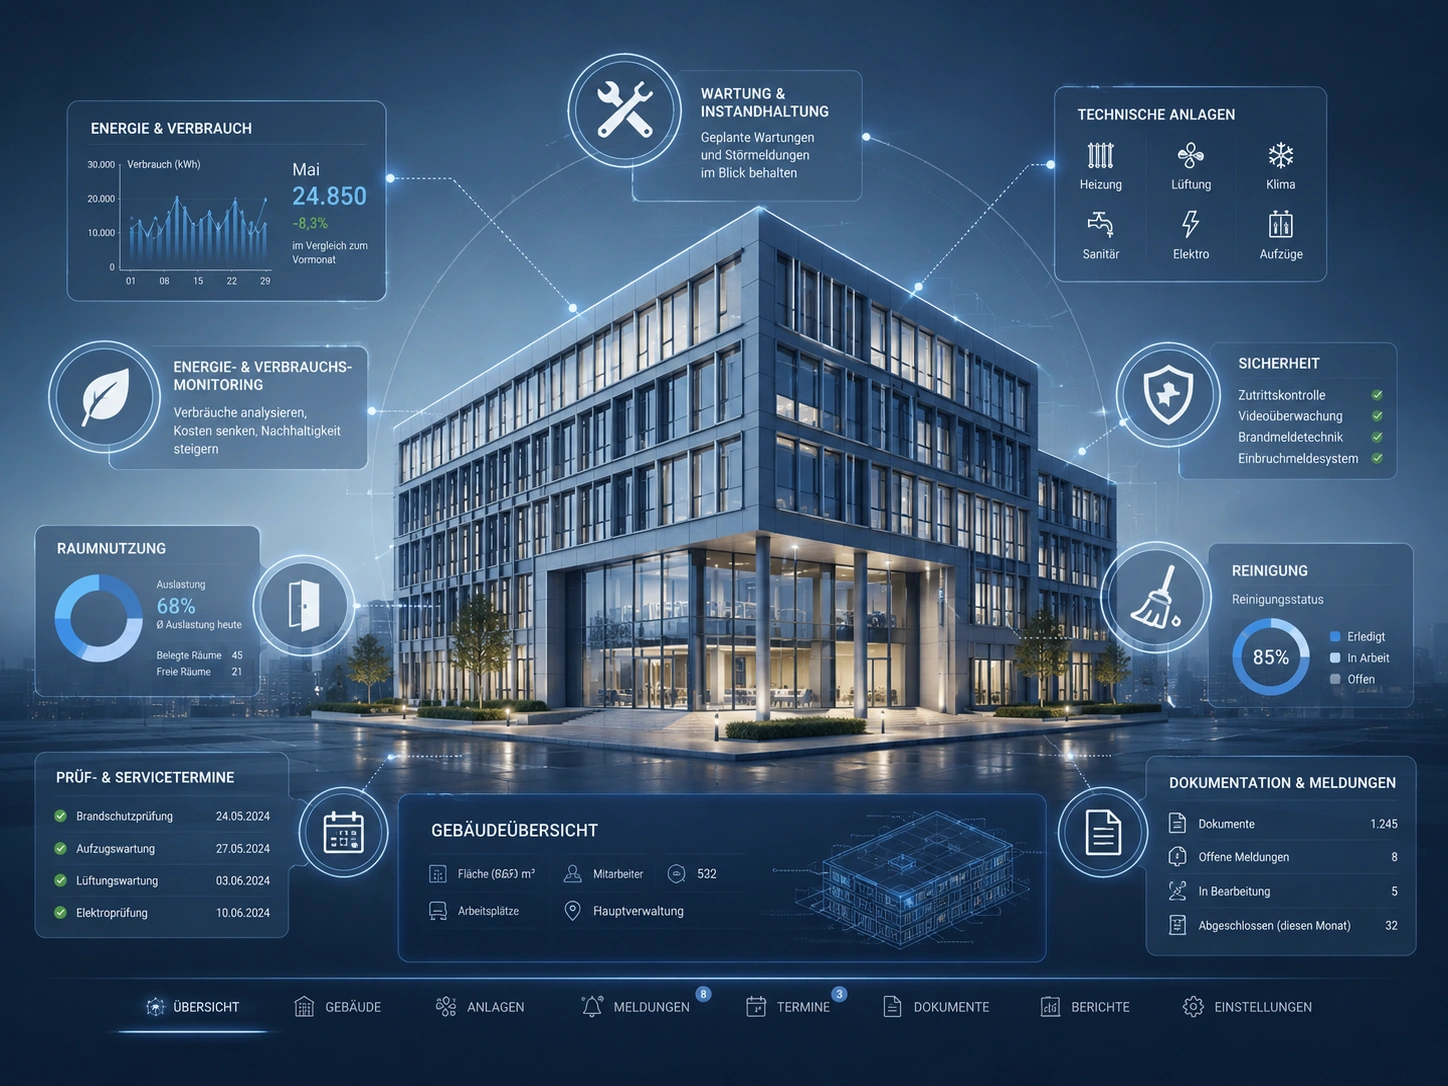
Key takeawayThe factory Facility Management Control Center turns properties, buildings, rooms, plants and inspection obligations into active management objects.
CAFM software as an active control center: object structure, inspection obligations, WatchDog, maintenance, documents and costs.
Go to product page: FM Facility Management ↗
What is a facility object?
The facility object is the control center's central information object. A facility object can, for example, be: a property, a building, a section of a building, a room, an apartment, a technical plant, an inspection-obligated object, a contract, a document, a maintenance case, a measure, an order or a contact person.
Every facility object brings its own information, deadlines, documents, obligations, costs and measures – and thereby becomes manageable.
Customization
The structure of the Facility Management Control Center is set up through customization – without programming. You define levels (e.g. property → building → rooms), attributes per object (e.g. status, area, monthly heating cost, particulars) and additional object categories (e.g. fire doors within a building).
This way, the control center follows your inventory and your processes.
What does "generic" mean?
Generic means: the system's core functions are programmed as integrable modules and can therefore be used for different levels and object types.
Example: documents, appointments, contacts, tasks, statuses, reminders, approvals and history all work for buildings just as they do for rooms, apartments, technical plants, fire doors, contracts or maintenance measures.
This lets even highly individual facility structures be mapped quickly and traceably.
WatchDog
The WatchDog automatically monitors dates and deadlines. Any deadline – including with individual lead times – can be used for monitoring: inspection dates, maintenance, document expiry dates, reminders or deficiency-correction deadlines.
The WatchDog can also check whether required corrections happened within set deadlines – and escalates to the defined party if the deadline is missed.
This way, the control center shows the facility manager in good time where an inspection, measure or decision is due.
MPM in facility management
Here, MPM refers to the cross-cutting management of multiple objects, measures and programs: a portfolio overview across all properties, prioritization of measures, budget and capacity planning, annual planning for inspections and maintenance, management reporting, and approval of measure packages.
Example: management sees all upcoming maintenance measures across multiple buildings, assesses priority, cost and urgency, and decides which measures to approve.
SPM in facility management
SPM stands for the operational management of individual cases: a single maintenance measure, inspection, servicing, tenant request, damage report, inspection tour, or a single modernization project.
Example: for a defective fire door, a case is created – with description, photos, inspection documents, responsible parties, deadline, service provider, costs, approval and completion documentation.
Energy & Sustainability Cockpit
Task: make consumption, cost and condition information for energy, heat and cooling visible by object – with comparisons across time periods and buildings, notable anomalies, and derived energy measures.
Example: heat consumption at Building C is markedly above comparable buildings in the portfolio. The control center makes the deviation visible, links it to the building and its plants – and from that insight a measure is directly created with responsible party, deadline and progress tracking, instead of a figure getting lost in a spreadsheet.
Operator Obligations Register
Task: manage all inspection-obligated objects in one register with obligation type, standard deadline, responsible party, service provider, evidence document and escalation rule – including documented delegation of obligations to internal or external parties.
Example: the recurring elevator inspection in Building B appears in the register with deadline, responsible inspector and stored evidence. The FM control center shows which obligation exists and also whether it has been fulfilled, documented and tracked – in an emergency, the decisive proof of operator responsibility.
Maintenance Cost Forecast
Task: build a reliable budget forecast from cost history per object, expected measures, recurring maintenance costs and identified renovation needs – with priority classes and portfolio comparison.
Example: the cost history of the heating systems across all buildings shows rising repair costs for two systems. The control center turns this into a budget forecast for the coming year – management recognizes the renovation need before the breakdown, not after.
Investment & Renovation Programs
Task: bundle multiple individual measures into a program, evaluate options, steer approvals, monitor project status, and prepare management decisions with documents.
Example: a facade renovation across three buildings is set up as a program: options with cost and benefit, approval per measure package, ongoing status per building. The FM control center keeps individual measures, budget and decisions together – following the same control-loop logic as the project control center.
Customer & Tenant Portal
Task: give customers, tenants and users direct, object-based access to their information via an FM portal – costs, consumption, documents and cases.
Example: the landlord of an office tower gives its customers access to their monthly climate-control costs – per unit, with evidence and history. The FM control center delivers the data directly from the object structure, instead of the management team sending out evaluations by email every month.
Mobile Damage Reporting
Task: capture damage and faults directly on site – with photo, object reference, priority and automatic forwarding as an order to the responsible handler or service provider.
Example: the caretaker photographs a damaged basement door with their smartphone. In the control center a case is created immediately at the correct object – with image, priority and order. Nothing gets lost on paper or in phone calls, and completion is documented.
Handover & Acceptance Processes
Task: conduct handovers and acceptances of units, areas or trades in a structured way – with checklists, protocols, photos, meter readings, identified deficiencies and measures generated from them.
Example: when handing over apartment A-14, the protocol is created digitally at the object: meter readings, photos, two identified deficiencies – which immediately become measures with a deadline before the next tenant moves in. The FM control center connects handover, evidence and follow-up tasks seamlessly.
Contract Management
Task: manage maintenance and lease contracts directly at the relevant object – with terms, notice periods, contacts, conditions and documents, monitored by the WatchDog.
Example: the maintenance contract for the elevator in Building B is attached to the plant object; its notice period is stored as a WatchDog deadline with lead time. The FM control center reminds in good time before a silent auto-renewal – and the "renew or re-tender" decision is prepared with the service provider's usage history and costs.
factory Kanban Team Management.
Key takeawayKANBAN-biz combines the Kanban board, Object-Map and Control Panel into one visual steering layer – tasks, status, blockers and responsibilities become visible, all without micromanagement.
KANBAN-biz extends the classic Kanban board into a visual steering layer: tasks, responsibilities, documents, approvals, suppliers, dependencies and status all become visible in one shared situational picture.
Go to product page: Kanban Team Management ↗
Steering work visually, in context
A simple Kanban board shows which task is in which status. KANBAN-biz additionally shows why a task is stuck: missing approvals, open documents, unclear responsibilities, supplier dependencies or blocked decisions.
The system combines operational task management with an Object-Map and a Control Panel. This creates transparency without micromanagement: teams recognize for themselves what needs to happen next, where bottlenecks arise, and which dependencies need clarifying.
Go to product page: Kanban Team Management ↗Glossary: KANBAN, Object-Map, pull principle and visual steering
These concepts explain how KANBAN-biz goes beyond a classic task board and makes work visible as a manageable result-oriented process.
KANBAN
Kanban is a method for visually steering work. Tasks are managed in columns such as "To-Do", "In Progress" and "Done".
KANBAN-biz uses this logic and extends it with context, responsibilities, documents and dependencies.
KANBAN-biz
KANBAN-biz is factory's solution for visual task and process management. It combines the Kanban board, Object-Map and Control Panel.
This visualizes tasks in an integrated way, in connection with people, documents, approvals, suppliers and decisions.
Kanban board
The Kanban board is the visual work surface on which tasks are ordered by status.
In KANBAN-biz, the board is the operational view of ongoing work and, at the same time, the entry point into each case's context.
Object-Map
The Object-Map shows which objects are connected: task, person, document, supplier, approval, contract or dependency.
It makes visible why a case is stuck and which information or decisions are relevant to the next step.
Control Panel
The Control Panel is the steering view for task status, responsibilities, open decisions, blockers and bottlenecks.
It helps leadership and teams recognize priorities without having to ask about every task individually.
Live Steering View
The Live Steering View is the current steering view of work, status, responsibilities and dependencies.
It replaces static status queries with a continuously updated overview.
Pull principle
Under the pull principle, employees independently pull tasks into their own work area once capacity and responsibility match.
This strengthens ownership and reduces operational assignment through micromanagement.
Micromanagement
Micromanagement means that leadership closely controls and re-steers every individual task.
KANBAN-biz relies on transparency: status, blockers and responsibilities are visible, so leadership can provide direction without constantly having to ask.
Visual steering layer
A visual steering layer makes work, states, bottlenecks and relationships recognizable at a glance.
KANBAN-biz uses the board, Object-Map and Control Panel as connected views for this purpose.
Task status
The task status shows which processing step a task is currently in.
Examples include "To clarify", "To-Do", "In Progress" and "Done".
To clarify
"To clarify" denotes tasks where benefit, purpose, roles, budget, documents or next steps still need to be clarified.
This column prevents unclarified tasks from moving prematurely into processing.
To-Do
"To-Do" contains tasks that are clarified and ready to be worked on.
In KANBAN-biz it can become visible which tasks have been sitting in this state too long or have not yet been picked up.
In Progress
"In Progress" describes tasks that are actively being worked on.
This view can be linked with progress, cost development, approvals or blockers.
Done
"Done" marks completed tasks.
In KANBAN-biz this also includes results, acceptances, documents and traceable completion information.
Blocker
A blocker is an obstacle that prevents further processing of a task.
Typical blockers include missing approvals, open questions, unavailable documents, or unclear responsibilities.
Bottleneck
A bottleneck arises when tasks, decisions or approvals slow down the entire process at one point.
KANBAN-biz makes bottlenecks visible through status, responsibilities and dependencies.
Responsibility
Responsibility means it is clear who is accountable for a task, decision, approval or delivery.
On the board this makes visible who is working on what and where support is needed.
Task pickup
Task pickup describes the moment a person actively takes on a task.
KANBAN-biz can make visible which tasks have been picked up, declined or not yet moved.
Declining a task
A decline means a task is not taken on, for example due to lack of responsibility, capacity or clarity.
It is important that the decline is visible and traceable, so the process can continue to be steered.
Status meeting
A status meeting is used to ask about work states, open items and problems.
KANBAN-biz reduces the need for such meetings, because status, blockers and responsibilities are already visible in the system.
Status round
A status round is a regular check-in on ongoing tasks.
With a current steering view, status rounds can focus more strongly on decisions and support.
Context logic
Context logic means that a task is connected with all relevant objects.
This includes documents, approvals, suppliers, business units, contracts and dependencies.
Result-oriented process
A result-oriented process aligns work toward a solid outcome.
KANBAN-biz connects tasks, documents, approvals and acceptances into a traceable path to results.
Team transparency
Team transparency means all participants can recognize which tasks are running, who is responsible, and where work is stuck.
This creates orientation without constant individual inquiries.
Intrinsic motivation
Intrinsic motivation arises when employees recognize the meaning, responsibility and impact of their work.
KANBAN-biz supports this by making tasks, progress and contribution to the result visible.
Workload
Workload describes how many tasks a person, team or role is currently handling.
Visual steering helps recognize overload and unevenly distributed work early.
Supplier management
Supplier management means integrating external suppliers, contracts, deadlines, services and questions into the work process.
KANBAN-biz can make supplier references visible within task and object context.
Approval process
An approval process defines who must review and approve a task, document, result or decision.
In KANBAN-biz, approvals become visible as part of the task and result process.
Audit-ready traceability
Audit-ready traceability means relevant steps, decisions, documents and states can later be reliably traced.
KANBAN-biz supports this by linking tasks, documents, status and history.
SaaS and on-premise
SaaS means operating as a cloud application. On-premise means operating on your own infrastructure.
KANBAN-biz can be described for both operating models and is therefore also suitable for organizations with special requirements for data sovereignty.
factory MPM Multi-Project Management.
Key takeawayThe factory Multi-Project Control Center steers all projects through a shared MPM layer – with target, plan, actual and forecast data, plus automatically calculated KPIs and cKPIs for solid portfolio decisions.
Portfolio radar, project cockpit and control loop for multi-project management, project controlling and project portfolio management.
Go to product page: MPM Multi-Project Management ↗
Definition of a project control center
Definition by project biz ↗
Control centers are technical systems for the online steering of complex processes. They are used wherever many different pieces of information need to be continuously brought together, evaluated and translated into fast, well-founded decisions.
The factory Project Control Center applies this principle to project management. It accompanies the project process from the first idea through the go/no-go decision to successful completion, and helps management steer measures and projects in a targeted way.
To this end, strategic goals, resources, priorities and other directives are captured systematically. The control center makes competing requirements visible, evaluates goals and feasibility against existing constraints, and thereby creates a solid basis for deciding which projects to start, prioritize and implement.
The two areas of Multi-Project Management (MPM) and Single-Project Management (SPM) work together here in real time. In the MPM area, management sets goals, priorities and steering directives. In the SPM area, project data from individual projects is captured – for example plan data, actual data, schedule changes, cost developments, resource information or supplier reports.
The Project Control Center condenses this information into steering-relevant metrics and makes it available to the MPM area as a current situational picture. At the same time, decisions from management directly feed back into the individual projects. This creates a closed steering loop: project changes generate management signals, management decisions trigger project actions.
What is Multi-Project Management (MPM)?
MPM is the management layer across all projects. Unlike the single project, it contains only the essential header data from individual projects – not activity-level details.
- Header data calculated from activity-level data: start, end, total cost, total result (PoP)
- Supplemented with other header data such as project name, key and text information
- Condensed metrics (KPIs & cKPIs) for prioritization and steering
- Drill-down into the associated single project as needed
What is Single-Project Management (SPM)?
SPM is the operational layer within a single project and holds all essential data.
- Activity-based planning: schedules including milestones, costs, resources, results (PoP)
- Activity-based actuals: actual costs, actual schedules, actual results (PoP)
- Header data: project name, keys, text information and calculated metrics
- Basis for all condensed metrics in MPM
What is target data?
Target data are directives at the MPM level that must be adhered to – for example strategic budget or schedule goals for a project.
Agile changes are routine here: target data is developed further as needed by the controlling lead via budget adjustment.
What is actual data?
Actual data are the real results at the SPM level – what has actually been achieved, consumed or completed in the project so far.
Together with plan data, they form the basis for target-actual comparisons and forecasts.
What is plan data?
Plan data are the details at the SPM level describing how the target directives are to be achieved – for example schedules, costs and resources per activity.
It is the operational translation of the strategic target data into a concrete project plan.
What are forecasts?
Forecasts are mathematical evaluations based on various recognized methods – for example Earned Value Management (EVM) or progress-degree methods (PoP).
They combine target, actual and plan data into a forward-looking assessment of how costs, schedules and results are likely to develop.
Why are budget adjustments so important?
Classic budget approval thinks in a fixed cycle: planned once, approved once, done. Agile projects work differently – priorities, scope and resource needs shift continuously.
That's why the Project Control Center reflects budget adjustment rather than rigid approval: the controlling lead can increase, decrease, or release planned budgets at any time – and the responsible project manager sees the decision reflected back immediately.
This keeps the budget as flexible as the project itself, without losing control over approvals.
The Cube: the activity layer across all projects
The Cube is the collection – or copy – of all activities from all single projects, one layer below the pure MPM header data.
It is needed, for example, for resource calculation: at the pure MPM level it's not possible to determine when which resource is needed – that requires access to the activity data from all projects.
KPI vs. cKPI
KPIs are metrics automatically calculated from standard plan and actual data – with no extra effort for the project manager.
cKPIs (combined KPIs) arise from combining multiple metrics and deliver deeper insight into planning quality, productivity and cost-effectiveness.
Guiding principle: minimal data entry – maximum informational value.
Completion degree of results (PoP)
PoP stands for a planned result unit, independent of effort. Example: 100 tables = 100 PoP, 30 screens = 60 PoP, 50 pages of a manual = 25 PoP, 10 meetings per employee = 10 PoP.
This measures completion by actual results and allows a Change Request to be submitted in cases of overachievement.
Completion degree of remaining effort
This complements budget consumption with the remaining-work perspective: budget consumption asks "plan minus actual," while completion degree asks "plan minus remaining" – together they give a realistic picture.
Budget consumption – time & money
Budget consumption (money) = Actual costs ÷ Plan costs
Two simple but central consumption metrics – the basis for cost-effectiveness and goal achievement.
CPI – Cost Performance Index
Measures productivity: were the completed activities realized at the planned cost? Only meaningful when planning and actuals use the same structure.
Norm: 100%Cost-effectiveness
Measures the cost-benefit ratio: was the budget needed to achieve the result as high as planned? A measure of investment efficiency.
Goal achievement
A measure of the overall effectiveness of the project. Example: CD = 50%, budget consumption = 50%, time consumption = 50% → goal achievement = 100%. With CD = 10%, budget consumption = 10%, time consumption = 20%, only 33% results.
Controlling-technical dead time
Shows how long it takes until the first activity of a project is completed – only then can a reliable CPI be measured.
The longer this dead time, the later it becomes apparent whether the plan was realistic: a direct measure of planning risk.
Benchmark for IT projects: below 12%Acceptance risk
The more activities are "open" at the same time, the greater the risk at acceptance. In actuals, this value corresponds to the maximum outstanding commitment (obligo).
Benchmark for IT projects: below 30%Resource peak
Answers the question: how many people are needed at peak load – e.g. how many experts with a specific skill are needed at the same time? Baseline loads should be considered separately here.
Project value per day
Shows how much budget a project manager is responsible for per day on average – an indicator of the maturity level required of the project management deployed.
Benchmark for consulting projects: under €20kProject value per activity
Shows how finely a project is structured – an indicator of the maturity of project planning.
Benchmark for IT projects: under €50kProject manager demand
A rough estimate of how much project management capacity a project needs – based on a company-specific experience value.
Benchmark in construction: norm of roughly €1 million in output per year per project managerExtendable live
The Project Control Center's metrics catalog is extendable. New metrics can be added during live operation – matched to your steering logic, your industry and your data base.
Just let us know which metric is still missing for your management.
Why do I need to "drive" the workflow?
Daily work is shaped by a flood of emails, chat messages and tickets – important information gets buried in it, and no one reacts on their own in time.
That's why the Project Control Center actively "drives" the workflow: it doesn't send a generic email, but a specific request to exactly the responsible person – with a link straight to "their" data screen where the decision or input is due.
The result: no searching for the right place in the system, no back-and-forth questions – just one click to the concrete task.
What is DMS in the project control center?
DMS stands for Document Management System. In the project control center, the DMS engine automatically links every relevant change with its evidence – a protocol, an approval, a contract, or a supplier document.
This keeps every metric, every escalation and every decision in the control center provable, without documents having to be manually searched for or linked.
What does PRM mean?
PRM stands for Partner and Role Management. The PRM engine automatically determines who is responsible for a case – role, person, team or decision-maker – even across company boundaries, for example with external suppliers or partner firms.
Only with PRM does the workflow know exactly who a request, approval or escalation needs to be addressed to.
What is KRITIS?
KRITIS stands for critical infrastructures – organizations and facilities whose failure would have significant consequences for public supply or public safety. This includes, among others, the energy, water, health, transport, food, financial and insurance, and information technology and telecommunications sectors.
Operators of critical infrastructure in Germany are subject to special legal requirements for IT security (including the BSI Act and the BSI KRITIS Regulation): they must comply with the state of the art, report security incidents, and regularly prove their precautions.
KRITIS-compliant delivery means for the Project Control Center: on-premise operation takes place entirely within your own secured infrastructure – without cloud requirements, optionally in isolated networks, with traceable update processes and a system architecture that fits your security and evidence requirements.
factory Skill Management.
Key takeawayfactory Skill Management makes competencies manageable – from self- and third-party assessment through skill gaps and role comparison to development planning, evidence and succession.
Competency development as a structured control center: capture skill profiles, bring together self- and third-party assessments, compare role requirements, and steer development paths in a traceable way.
Go to product page: Skill Management ↗
The basic logic: make competencies visible, compare role requirements, steer development.
The Skill Management Portal combines competency profiles, self- and third-party assessment, requirement profiles, development planning and evidence into a confidential process. This creates a solid basis for personnel development, reorganization, AI transformation, succession planning and consulting projects.
From individual profile to transformation situational picture.
Assessments, comments, development states, evidence, responsibilities and progress are brought together on a role-based basis. Management gains orientation, HR and managers gain steering capability, employees gain traceable development perspectives.
Skill management
Skill management is the structured capture, assessment and development of competencies. It shows which abilities already exist, which requirements will arise in the future, and which development steps can be derived from that.
In the factory Skill Management Portal, this becomes a software-supported process with competency profiles, self- and third-party assessment, role comparison, development planning, evidence, permissions and progress documentation.
Competency profile / skill profile
A competency profile describes a person's existing abilities, experience, qualifications and development states. It can cover functional, methodological, social, digital and leadership-related competencies.
The profile is the personal data foundation for development conversations, development measures, role options and succession planning.
Competency profile matrix
The competency profile matrix is the company-specific structure in which competencies are organized. It defines categories, individual competencies, assessment scales and, where applicable, target levels.
It ensures assessments remain comparable while still fitting the organization, unit, role or transformation task.
Competency categories
Competency categories bundle individual competencies into understandable groups. Typical categories in the factory context include AI Moderator/Orchestrator, Process Competence & Subject-Matter Knowledge, Social Competence, Learning & Change Competence, and Leadership & Steering Competence.
The categories make it easier to evaluate competency profiles and plan development focus areas in a targeted way.
Self-assessment
Self-assessment is the employee's own evaluation of their own competencies. It makes their own perspective visible and prepares a structured development conversation.
It is important that self-assessment is understood as a starting point for dialogue, orientation and personal development.
Third-party assessment
Third-party assessment is the evaluation performed by an authorized role, for example a manager, project lead, trainer or subject-matter owner.
It supplements the self-view with an external work or leadership perspective. Together, both assessments provide a solid foundation for development measures.
Assessment comparison
Assessment comparison compares self- and third-party assessment. It shows agreements, differences and where conversation is needed.
The goal is not to hunt for mistakes but to develop a shared understanding: which strengths are confirmed? Where is development desired? Where do perceptions differ?
Skill gap
A skill gap is the difference between existing competency and required competency. It can arise between self- and third-party assessment, or between the current competency profile and a future role profile.
Skill gaps are valuable steering information: they can be used to derive development measures, mentoring, hands-on assignments or new learning paths.
Radar chart / skill radar
The radar chart visualizes multiple competencies at once. It shows assessments on a scale and quickly makes differences between self- and third-party assessment, or between current and target profile, visible.
This makes it especially suitable for development conversations, role comparisons and management overviews.
Role profile / requirement profile
A role profile describes the competencies, experience and evidence required for a current or future role. It translates organizational goals into concrete requirements for people and teams.
In the portal, a role profile can be compared against existing employee profiles. This produces development options, qualification needs and possible deployment perspectives.
Target-actual comparison in skill management
The target-actual comparison compares the existing competency level with the target level of a role, task or transformation. It shows where existing strengths already fit directly, and where targeted development makes sense.
The comparison supports personnel development, reorganization, succession planning and preparation of future deployment options.
Skill matching
Skill matching refers to the structured comparison of employee profiles with role or project requirements. It shows which people are a particularly good fit and which development steps make sense for a target role.
Matching serves fair and traceable development planning.
Role option
A role option is a possible future deployment perspective for a person. It arises from existing competencies, development interests, role requirements and organizational goals.
The portal makes role options visible and supports the preparation of development conversations and qualification plans.
Four-eyes principle in the assessment process
The four-eyes principle ensures that the self- and third-party perspectives are brought together, commented on and reconciled.
This increases traceability, fairness and acceptance in the transformation process.
Development planning
Development planning describes deriving concrete measures from assessments, skill gaps and role requirements. This includes training, on-the-job training, mentoring, project practice, certifications or new assignments.
In the portal, development measures are documented with a goal, responsibility, deadline, status and progress.
Qualification measure
A qualification measure is a concrete step toward competency development. It can be formal, such as training or a certificate, or hands-on, such as guidance from experienced colleagues.
What matters is the connection to a goal: every measure should contribute to a competency, a role profile or a transformation need.
Development roadmap
The development roadmap arranges multiple measures into a temporal and functional sequence. It shows how a person or team is developed step by step toward future roles.
This turns personnel development from an individual conversation into a traceable steering process.
Evidence, certificates and qualification documents
Evidence documents existing or newly acquired competencies. This includes certificates, training records, qualification documents, development agreements or project confirmations.
In the portal, evidence is managed in a structured way within the competency or development profile. This keeps it traceable which abilities are proven and which measures have been completed.
Progress conversation
A progress conversation assesses how competencies, measures and role options are developing. It uses current assessments, documented evidence and the status of the development roadmap.
This implements competency development as an ongoing dialogue.
Version history and historization
Historization means that assessments, comments, development states and evidence remain traceable over time. Changes are documented and can be explained later.
This is especially important in reorganizations, succession planning, development agreements and consulting projects.
Confidentiality in skill management
Skill data is sensitive development data. Confidentiality means that only authorized roles gain access to assessments, comments, evidence and development states.
The portal supports this principle through a role-based permission concept. This builds trust in the assessment and development process.
Role-based permission concept
The role-based permission concept determines who may see, edit, comment on or approve which information. Typical roles include employees, managers, HR, management, consultants or administrators.
The concept combines data protection, process clarity and steering capability.
HR role
HR supports the skill management process through methodology, development offerings, qualification planning and organizational coordination. Access to personal assessments should be clearly regulated.
This allows HR to support the transformation without weakening the confidentiality of personal development conversations.
Manager in the skill process
The manager contributes the work perspective, conducts third-party assessments, discusses development opportunities and accompanies measures. They connect company requirements with individual development.
In the portal, these tasks are supported in a structured and traceable way.
Employees in the skill process
Employees contribute their own perspective, interests, experience and development goals. Self-assessment strengthens participation and makes the process dialogue-oriented.
This means competency development is implemented collaboratively.
Transformation & change management
Transformation changes roles, tasks, collaboration and requirements. Skill management makes visible which competencies exist today and which competencies should be built for tomorrow's organization.
The portal supports change management by combining orientation, participation, confidentiality and progress steering.
Reorganization and new role models
A reorganization creates new responsibilities and new roles. The Skill Management Portal helps to describe requirements transparently, compare existing competencies, and plan development paths in a traceable way.
This links organizational decisions with fair development processes.
AI transformation
AI transformation requires new competencies: understanding AI applications, process thinking, data literacy, moderating between humans and systems, and responsible use.
Skill management shows which competencies already exist and which development steps make sense for new AI-supported roles.
Demographic change and succession planning
When experienced employees leave, competencies, experiential knowledge and succession options need to become visible early. Skill management helps to identify knowledge holders, development needs and possible successors in a structured way.
This makes succession planning forward-looking and traceable.
Consulting projects and white-label use
In consulting projects, the Skill Management Portal can be used to structurally map competency analyses, role models, development roadmaps and progress.
White-label and multi-tenant use helps consulting firms translate methodological concepts professionally into software processes.
factory Workflow Engine.
Key takeawayThe factory Workflow Engine replaces group inboxes with intelligent case steering – five combinable steering logics drive work in a targeted way to the right person, role or action.
The factory Workflow Engine is the steering logic behind many factory products. It evaluates object information, status values, roles, rights and rules together and turns them into the appropriate next step: notification, approval, reminder, processing dialog or escalation.
Go to product page: Workflow Engine ↗
From information to action.
The Workflow Engine works according to the control-center principle: states are captured, rules are checked, and permitted actions are triggered. Unlike purely technical automation, the person handling the case stays in the driver's seat – they receive guided, authorized options for the next step.
Glossary: workflow, trigger, roles, rights and orchestration
These concepts explain how the factory Workflow Engine turns object information and rules into active process steering.
Workflow Engine
The Workflow Engine is the central steering logic that evaluates information, rules, roles and rights.
It decides dynamically, thereby linking object status, attributes, permissions and defined process rules into an appropriate next step.
Workflow software
Workflow software supports the digital steering of business processes.
It makes visible which step is due, who is responsible, which rule applies, and which action is triggered.
Control-center principle
The control-center principle means: capture states, evaluate them, and derive actions from them.
factory applies this principle to business processes, approvals, roles and functional responsibility.
Object domain
The object domain describes the functional objects a workflow operates on.
These can be projects, contracts, documents, risks, tasks, assets or other business objects. Every object carries attributes used for decisions.
Object information
Object information is data describing a business object: status, budget, priority, due date, responsible party, risk value or organizational unit.
It is the raw material for workflow decisions.
Attribute
An attribute is a single information field of an object, for example budget, status, deadline or priority.
Attributes can be used in workflows as a trigger, filter or decision basis.
Trigger
A trigger is a prompt for an action.
Examples: a status changes, a budget exceeds a threshold, a deadline approaches, or a risk value rises.
Status change
A status change describes an object's transition from one state to the next.
Examples include Draft → Review, Review → Approval, or Approval → Order.
Standard workflow
A standard workflow consists of fixed stations and permitted status changes.
It suits recurring processes such as draft, review, approval, order and invoicing.
Budget-dependent workflow
A budget-dependent workflow steers approvals based on amount thresholds.
Depending on the budget level, the appropriate role is automatically brought in, for example the department head or executive management.
Target-person-dependent workflow
In a target-person-dependent workflow, the person handling the case selects the next target person.
The selection is guided: only roles and people permitted by the rights concept are offered.
Change-triggered workflow
A change-triggered workflow starts as soon as a relevant attribute changes.
Examples: budget rises above a threshold, priority becomes high, a due date approaches, or a metric reaches a limit value.
Rights-driven workflow
A rights-driven workflow considers at every step what a role may view, edit or approve.
This automatically limits selection options, actions and target persons to permitted choices.
Workflow orchestration
Workflow orchestration combines multiple steering logics into a shared process.
Status, attribute, role, right and trigger are evaluated together, producing exactly the appropriate next step.
Workflow definition
A workflow definition describes which stations, status changes, target roles, approvals and escalations apply to an object type.
It is the functional configuration of the process.
Target role
A target role is the role that should take on the next step in the workflow.
Examples include reviewer, approver, contract manager, project lead or executive management.
Target person
A target person is the specific individual to whom a work step, approval or piece of information is forwarded.
The Workflow Engine can restrict selection to the authorized people within a target role.
Approval
An approval is the binding confirmation that an object, document, budget or case may proceed to the next step.
The Workflow Engine can steer approvals based on status, budget, role and right.
Escalation
An escalation is a targeted forwarding or notification when a case becomes critical.
Typical triggers include missed deadlines, critical priorities, rising risk values, or unprocessed approvals.
Reminder
A reminder is a planned recall or re-presentation of a case.
The Workflow Engine can derive reminders automatically from deadlines, status or inspection intervals.
Notification
A notification informs the responsible role or person about a new step, an open approval, or a critical state.
It can be triggered by status changes, deadlines or attribute changes.
Processing dialog
A processing dialog is the guided interface for the next work step.
It shows the relevant information and actions permitted for the role, object and process.
Rights concept
The rights concept determines who may view, edit, approve or lock which information.
In the Workflow Engine, it thereby becomes an active component of process steering.
Attribute visibility
Attribute visibility describes which role may see specific data fields.
For example, an external partner might see only selected fields, while internal roles receive additional processing information.
Editing right
An editing right allows a role or person to change specific information or carry out a work step.
The Workflow Engine takes these rights into account at every step.
Approval right
An approval right determines who may bindingly approve a case.
In budget-dependent workflows, the approval right can additionally depend on amount thresholds.
Selection restriction
Selection restriction means that only permitted options are offered in the workflow.
This can affect target persons, roles, status changes, actions or editable fields.
Process reliability
Process reliability means that processes are carried out in a structured, rule-compliant and traceable way.
The Workflow Engine supports this through rules, rights, history and guided next steps.
Audit-ready logging
Audit-ready logging means that relevant steps, decisions, status changes and approvals remain traceable afterward.
It makes visible when which step was triggered or completed by which role.
Driver's seat
"Driver's seat" describes the role of the person handling the case within factory's workflow logic.
The human remains steering-involved, but receives only the functionally appropriate and authorized options for the next step.
Missing a term? Get in touch.
We continuously expand this know-how guide based on our projects and our customers' questions.